Lessons
- Descriptive Vs. Inferential Statistics
- Types of Measurement Scales
- Parameter, Sample Statistic, and Frequency Distribution
- Relative Frequencies and Cumulative Relative Frequencies
- Properties of a Data Set (Histogram / Frequency Polygon)
- Measures of Central Tendency
- Calculating Arithmetic Mean
- Calculating Weighted Average Mean
- Calculating Geometric Mean
- Calculating Harmonic Mean
- Calculating Median and Mode of a Data Set
- Quartiles, Quintiles, Deciles, and Percentiles
- Range and Mean Absolute Deviation
- Variance and Standard Deviation
- Chebyshev’s Inequality
- Coefficient of Variation
- Sharpe Ratio
- Skewness and Kurtosis
- Relative Locations of Mean, Median and Mode
Chebyshev’s Inequality
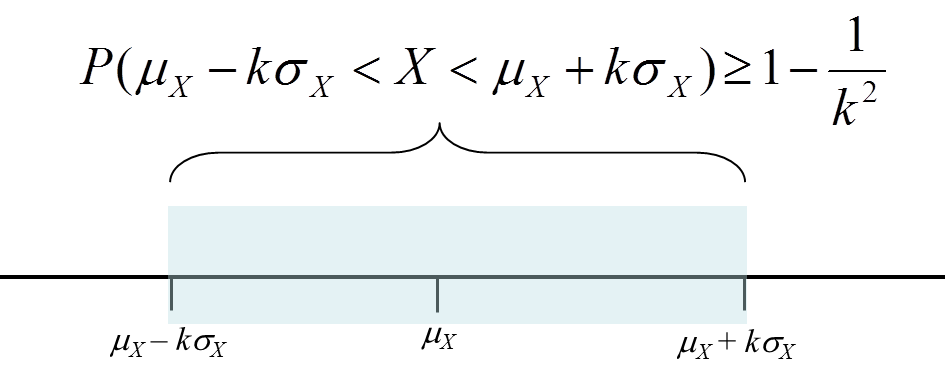
Chebyshev’s Inequality is used to describe the percentage of values in a distribution within an interval centered at the mean.
It states that for a distribution, the percentage of observations that lie within k standard deviations is atleast 1 – 1/k2
This is illustrated below:
Example
The following table shows the minimum number of observations that lie within a certain number of standard deviations of the mean.
Standard Deviations | % of observations |
1.5 | 56% |
2 | 75% |
3 | 89% |
4 | 94% |
An important feature of Chebyshev’s Inequality is that it works with any kind of distribution.
Related Downloads
Related Quizzes
Membership
Learn the skills required to excel in data science and data analytics covering R, Python, machine learning, and AI.
I WANT TO JOINJOIN 30,000 DATA PROFESSIONALS
Free Guides - Getting Started with R and Python
Enter your name and email address below and we will email you the guides for R programming and Python.