Finance Train LogoFinance Train
Learning LibraryTemplatesBlog
Data Science Bundle
Finance TrainFinance Train
Learning LibraryTemplatesBlog
Data Science Bundle
Lesson 7 of 19

Calculating Arithmetic Mean

Arithmetic mean is the simple average of all observations and is calculated by adding all the observations and dividing it by the total number of observations.

We can calculate arithmetic mean for both the population and the sample.

Population Mean

This is the arithmetic mean of all observations in the population. The formula for population mean is given below:

Population Mean
Population Mean

Sample Mean

This is the arithmetic mean of all observations in the sample of the population. The formula for sample mean is given below:

Sample Mean
Sample Mean

Notice the difference in notations between the two formulas:

Xi represents the observations in both formulas.

The number of observations in the population is represented by capital N, while the number of observations in the sample is represented by small n.

Example

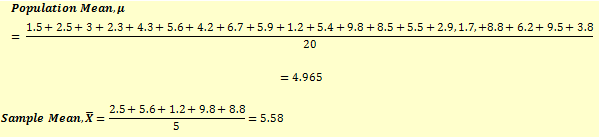
Population Dataset: 1.5, 2.5, 3, 2.3, 4.3, 5.6, 4.2, 6.7, 5.9, 1.2, 5.4, 9.8, 8.5, 5.5, 2.9, 1.7, 8.8, 6.2, 9.5, 3.8

We can draw a sample from the above data set.

Sample Dataset: 2.5, 5.6, 1.2, 9.8, 8.8
ct3
ct3

Some observations:

  • As you can see, there is a lot of difference in population mean and sample mean. This can happen for small data sets or if the sample is not drawn correctly.
  • Arithmetic mean is very sensitive to extreme values as a very large or small value can significantly pull the mean on either side.
  • For arithmetic mean, the sum of deviations from the mean is always zero, i.e.,
  • Arithmetic mean is preferred over median and mode, as it uses all information about the observations such as size and magnitude.
  • There can be only one arithmetic mean for a data set.
Previous Lesson

Measures of Central Tendency

Next Lesson

Calculating Weighted Average Mean

Back to ebook

Statistical Concepts and Market Returns

19 lessons

Lessons

1
Descriptive Vs. Inferential Statistics
2
Types of Measurement Scales
3
Parameter, Sample Statistic, and Frequency Distribution
4
Relative Frequencies and Cumulative Relative Frequencies
5
Properties of a Data Set (Histogram / Frequency Polygon)
6
Measures of Central Tendency
7
Calculating Arithmetic Mean
8
Calculating Weighted Average Mean
9
Calculating Geometric Mean
10
Calculating Harmonic Mean
11
Calculating Median and Mode of a Data Set
12
Quartiles, Quintiles, Deciles, and Percentiles
13
Range and Mean Absolute Deviation
14
Variance and Standard Deviation
15
Chebyshev’s Inequality
16
Coefficient of Variation
17
Sharpe Ratio
18
Skewness and Kurtosis
19
Relative Locations of Mean, Median and Mode

Quizzes

Statistical Concepts and Market Returns
Finance Train

Learn data science and AI skills for finance through practical courses and tutorials.

Learn

  • Learning Library
  • Course Directory
  • Blog

Resources

  • Templates & Downloads
  • Tools
  • Tables
  • Calculators

Company

  • About
  • Contact
  • Privacy
  • Terms

© 2026 Finance Train. All rights reserved.