Calculating Geometric Mean
One problem with arithmetic mean is that it assumes the returns on the investment made at the beginning of each period. So, for each period the beginning investment amount is assumed to be the same. It ignores the compounding effect of investment returns made in the previous years. Using arithmetic returns, our measure can be majorly flawed. Consider an investment of $100 at the beginning. Say in the first year the investment value rises to $200. The returns are 100%. In year 2, the investment falls back to $100, which will be a return of -50% in the year 2. If we take the average of two year returns, i.e., 100% in year 1 and -50% in year 2, it shows an average annual return of 25% on this investment, even though our investment value is back to $100 (from where we started). This problem can be solved by calculating geometric returns which incorporates the compounding effect.
Let’s taken an example to understand how geometric returns are calculated. Let’s say our portfolio generated the following returns in 5 years.
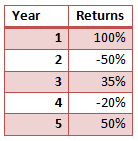
Geometric returns = [(1+100%)*(1-50%)*(1+35%)*(1-20%)*(1+50%)]^(1/5) – 1 = 10%
The arithmetic mean on this portfolio would have been 23%.
As you can see, geometric return is lower than the arithmetic return, and is a better method for aggregating returns over multiple holding periods.
We can say that geometric mean is a more suitable method for aggregating returns over a period of time.
Test Your Knowledge
Check your understanding of this lesson with a short quiz.