• Skip to primary navigation
  • Skip to main content
  • Skip to primary sidebar
  • Skip to footer
Finance Train

Finance Train

High Quality tutorials for finance, risk, data science

  • Home
  • Data Science
  • CFA® Exam
  • PRM Exam
  • Tutorials
  • Careers
  • Products
  • Login

Model Selection in Machine Learning

Data Science

This lesson is part 7 of 22 in the course Machine Learning in Finance Using Python

Model selection refers to choose the best statistical machine learning model for a particular problem. For this task we need to compare the relative performance between models. Therefore the loss function and the metric that represent it, becomes fundamental for selecting the right and non-overfitted model. 

We can state a machine learning supervised problem with the following equation:

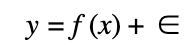
This equation is composed with the x matrix that contains the predictor’s factors x1,x2,x3,…xn. These factors can be the lagged prices/returns of a time series or some others factors such as volume, foreign exchange rates, etc.  y is the response vector that depend of the function f and the predictors x.

f contain the underlying relationship between the x features and the y response and can be modeled with a linear regression if the underlying relationship is linear or with a Random Forest or Support Vector Machine algorithm if the underlying relationship is non-linear.

Ε represent the error term, which is often assumed to have mean zero and a standard deviation of one.

Once we fit a particular model for a certain dataset, we need to define the loss function that we will use to assess model performance. Many measures can be used for the loss function. Some common measures for the loss function are the Absolute Error and the Squared Error between predicted values and real values. 

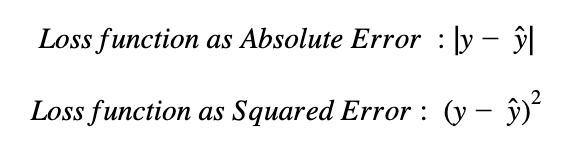
Both choices are non-negative, so the best value for the loss function is zero. The Absolute Error and Squared Error above, compute the difference between the true value (y)  and the prediction (y)  for each observation of the dataset.

Both the Absolute Error and Squared Error are vectors or arrays of n x 1 dimension, reflecting the error term per each of the observations. In order to aggregate the error term of a certain model between all the predicted and real values of a variable, a popular measure is the Mean Squared Error which is simply the average of the squared loss: 


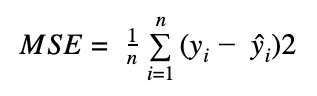
Where n is the number of observations
Previous Lesson

‹ Evaluate Model Performance – Loss Function

Next Lesson

Bias Variance Trade Off ›

Join Our Facebook Group - Finance, Risk and Data Science

Posts You May Like

How to Improve your Financial Health

CFA® Exam Overview and Guidelines (Updated for 2021)

Changing Themes (Look and Feel) in ggplot2 in R

Coordinates in ggplot2 in R

Facets for ggplot2 Charts in R (Faceting Layer)

Reader Interactions

Leave a Reply Cancel reply

Your email address will not be published. Required fields are marked *

This site uses Akismet to reduce spam. Learn how your comment data is processed.

Primary Sidebar

In this Course

  • Machine Learning with Python
  • What is Machine Learning?
  • Data Preprocessing in Data Science and Machine Learning
  • Feature Selection in Machine Learning
  • Train-Test Datasets in Machine Learning
  • Evaluate Model Performance – Loss Function
  • Model Selection in Machine Learning
  • Bias Variance Trade Off
  • Supervised Learning Models
  • Multiple Linear Regression
  • Logistic Regression
  • Logistic Regression in Python using scikit-learn Package
  • Decision Trees in Machine Learning
  • Random Forest Algorithm in Python
  • Support Vector Machine Algorithm Explained
  • Multivariate Linear Regression in Python with scikit-learn Library
  • Classifier Model in Machine Learning Using Python
  • Cross Validation to Avoid Overfitting in Machine Learning
  • K-Fold Cross Validation Example Using Python scikit-learn
  • Unsupervised Learning Models
  • K-Means Algorithm Python Example
  • Neural Networks Overview

Latest Tutorials

    • Data Visualization with R
    • Derivatives with R
    • Machine Learning in Finance Using Python
    • Credit Risk Modelling in R
    • Quantitative Trading Strategies in R
    • Financial Time Series Analysis in R
    • VaR Mapping
    • Option Valuation
    • Financial Reporting Standards
    • Fraud
Facebook Group

Membership

Unlock full access to Finance Train and see the entire library of member-only content and resources.

Subscribe

Footer

Recent Posts

  • How to Improve your Financial Health
  • CFA® Exam Overview and Guidelines (Updated for 2021)
  • Changing Themes (Look and Feel) in ggplot2 in R
  • Coordinates in ggplot2 in R
  • Facets for ggplot2 Charts in R (Faceting Layer)

Products

  • Level I Authority for CFA® Exam
  • CFA Level I Practice Questions
  • CFA Level I Mock Exam
  • Level II Question Bank for CFA® Exam
  • PRM Exam 1 Practice Question Bank
  • All Products

Quick Links

  • Privacy Policy
  • Contact Us

CFA Institute does not endorse, promote or warrant the accuracy or quality of Finance Train. CFA® and Chartered Financial Analyst® are registered trademarks owned by CFA Institute.

Copyright © 2021 Finance Train. All rights reserved.

  • About Us
  • Privacy Policy
  • Contact Us