K-Fold Cross Validation Example Using Python scikit-learn
In this post, we will provide an example of Cross Validation using the K-Fold method with the python scikit learn library. The K-Fold Cross Validation example would have k parameters equal to 5. By using a ‘for’ loop, we will fit each model using 4 folds for training data and 1 fold for testing data, and then we will call the accuracy_score method from scikit learn to determine the accuracy of the model.
The example is divided into the following steps:
- Step 1: Import the libraries and load into the environment Open, High, Low, Close data for EURUSD
- Step 2: Create features with the create_features() function
- Step 3: Run the model with the Validation Set approach
- Step 4: Run the model with the K-Fold Cross Validation approach
1import pandas as pd
2from sklearn.model_selection import KFold
3import numpy as np
4from sklearn.metrics import accuracy_score
5from sklearn import tree
6import matplotlib.pyplot as plt
7import seaborn as sns
8
9# Read csv file to load into the environment OHLC data from EURUSD.
10eurusd_ohlc = pd.read_csv("C:/Users/Nicolas/Documents/Machine Learning Course/eurusd.csv")
11
12# The create_features function, receives the eurusd_ohlc parameter and create new features to use in a machine learning model
13
14def create_features(fx_data):
15 '''
16 Parameters:
17 fx_data: has Open-High-Low-Close data for currency pair EURUSD between 2001-08-21 to 2019-09-21
18 Return:
19 fx_data: dataframe with original and new data with the features of the model
20 target: target variable to predict, which contains the direction of the price. The values can be 1 for up direction and -1 for down direction.
21 '''
22
23 # Convert all columns of the stock_data data frame to numeric columns
24 fx_data = fx_data.apply(pd.to_numeric)
25
26 # Reverse the index to have old values at top of the dataframe
27 fx_data = fx_data.sort_values('Date')
28
29 # Create features to use in the machine learning model
30 fx_data['High-Low'] = fx_data['High'] - fx_data['Low']
31 fx_data['pct_change'] = fx_data['Close'].pct_change()
32 fx_data['ret_5'] = fx_data['pct_change'].rolling(5).mean()
33
34 # Calculate RSI Indicator
35 close = fx_data['Close']
36 # Get the difference in price from previous step
37 delta = close.diff()
38 # Get rid of the first row, which is Nan since it did not have a previous
39 # row to calculate the differences
40 delta = delta[1:]
41
42 # Make the positive gains (up) and negative gains (down) Series
43 up, down = delta.copy(), delta.copy()
44 up[up < 0] = 0
45 down[down > 0] = 0
46
47 # Calculate the EWMA
48 roll_up = up.rolling(center=False,window=14).mean()
49 roll_down = abs(down).rolling(center=False,window=14).mean()
50
51 # Calculate the RSI based on EWMA
52 RS = roll_up / roll_down
53 RSI = 100.0 - (100.0 / (1.0 + RS))
54
55 fx_data['RSI'] = RSI
56 fx_data.dropna(inplace=True)
57 # Create the target variable that take the values of 1 if the stock price go up or -1 if the stock price go down
58 target = np.where(fx_data['Close'].shift(-1) > fx_data['Close'], 1, -1)
59
60 return fx_data, target
61
62features, target = create_features(eurusd_ohlc)
63
64# Validation Set approach : take 80% of the data as the training set and 20 % as the test set. X is a dataframe with the input variable
65X = features[['High-Low', 'pct_change', 'ret_5','RSI']]
66
67# Y is the target or output variable
68y = target
69
70length_to_split = int(len(features) * 0.8)
71# Splitting the X and y into train and test datasets
72X_train, X_test = X[:length_to_split], X[length_to_split:]
73y_train, y_test = y[:length_to_split], y[length_to_split:]
74
75# Print the size of the train and test dataset
76print(X_train.shape, X_test.shape)
77print(y_train.shape, y_test.shape)
78
79clf = tree.DecisionTreeClassifier(random_state=20)
80
81# Create the model on train dataset
82model = clf.fit(X_train, y_train)
83
84# Calculate the accuracy
85print(accuracy_score(y_test, model.predict(X_test), normalize=True)*100)
86
87# KFold Cross Validation approach
88kf = KFold(n_splits=5,shuffle=False)
89kf.split(X)
90
91# Initialize the accuracy of the models to blank list. The accuracy of each model will be appended to this list
92accuracy_model = []
93
94# Iterate over each train-test split
95for train_index, test_index in kf.split(X):
96 # Split train-test
97 X_train, X_test = X.iloc[train_index], X.iloc[test_index]
98 y_train, y_test = y[train_index], y[test_index]
99 # Train the model
100 model = clf.fit(X_train, y_train)
101 # Append to accuracy_model the accuracy of the model
102 accuracy_model.append(accuracy_score(y_test, model.predict(X_test), normalize=True)*100)
103
104# Print the accuracy
105print(accuracy_model)
106
107(3989, 4) (998, 4)
108(3989,) (998,)
10951.4028
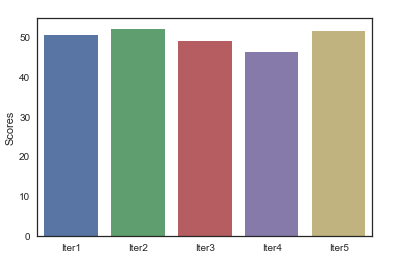
110[50.501, 52.004, 48.9468, 46.1384, 51.3541]
111These 4 lines above are the outputs of the print() messages. (3989, 4) (998, 4) are the size of the X_train and X_test dataset where 3989 is the number of observations in the train dataset and 4 is the number of features in the train dataset. 998 is the number of observations in the test dataset, and 4 is the number of features in the test dataset.
(3989,) (998,) are the size of y_train and y_test. 51.4028 is the accuracy score with the Validation set approach and [50.501, 52.004, 48.9468, 46.1384, 51.3541] is the accuracy_model list which show the accuracy in each iteration using the K-Fold Cross Validation method.
K-Fold Cross Validation gives a better idea of how the model will perform with new or live data, because we have used 5 different testing sets to obtain measures of the model performance.
Finally we use a bar plot to visualize the score measure in each iteration:
1### Visualize accuracy for each iteration
2
3scores = pd.DataFrame(accuracy_model,columns=['Scores'])
4
5sns.set(style="white", rc={"lines.linewidth": 3})
6sns.barplot(x=['Iter1','Iter2','Iter3','Iter4','Iter5'],y="Scores",data=scores)
7plt.show()
8sns.set()
9
K-Fold Cross Validation Scores