Test Statistic, Type I and type II Errors, and Significance Level
Test Statistic
A test statistic is a quantity, calculated based on a sample, whose value is the basis for deciding whether or not to reject the null hypothesis.
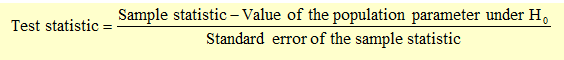
In our example, the sample statistic is the mean. Therefore, the test statistic will be:

Type I and Type II Error
When drawing an inference (from a sample statistic, about a population parameter), there can be two types of errors: Type I and Type II.
Type I error, also known as error of the first kind, occurs when the null hypothesis is true, but is rejected.
Type II error, also known as the error of the second kind, occurs when the null hypothesis is false, but is accepted as true.
Significance Level
The level of significance of a test is the probability of a Type I error that we accept in conducting a hypothesis test. It is denoted by α. For example, a significance level of 5% means that there is a 5% probability that a true null hypothesis will be rejected.
It is essential to specify a significance level in a hypothesis test. We then identify the critical value (such as z-statistic) and compare it with our test statistic to accept or reject a hypothesis.
Let’s continue with our example. If the level of significance is 5%, then using the z-test the critical value will be +/-1.96 for a two tailed test.
Observing z-values
Two-tailed Test
For a two-tailed test, at a 5% level of significance, we have 2.5% on either tail.
z-value for the left tail will be observed as follows: In the z-table, look for the value of z where F(Z) is 0.0250, i.e., z = -1.96.
z-value for the right tail will be observed as follows: In the z-table, look for the value of z where F(Z) is 0.9750, i.e., z = 1.96
Test Your Knowledge
Check your understanding of this lesson with a short quiz.