F-test - Test for the Differences Between Two Population Variances
The tests concerning the differences between two population variances are called F-test. We are testing the equality of two variances.
For this test, we calculate a F-distributed test statistic that follows the F-distribution.
Here also we assume that the samples are normally distributed and are independent.
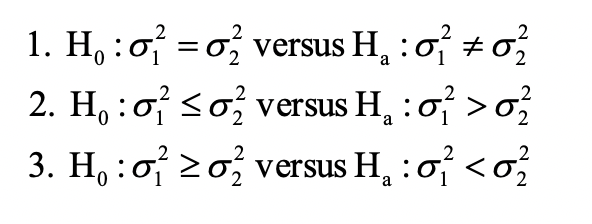
The hypothesis is formed as follows:
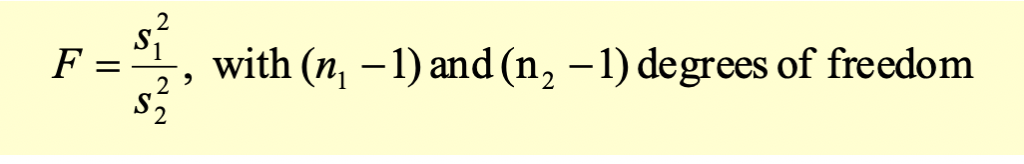
Assume we have two samples with n1 and n2 observations. The test statistic for F-test is calculated as follows:
We use the degrees of freedom to identify the critical value from the F-table.
The F distribution is an asymmetric distribution that has a minimum value of 0, but no maximum value. The curve reaches a peak not far to the right of 0, and then gradually approaches the horizontal axis the larger the F value is. The F distribution approaches, but never quite touches the horizontal axis.
All the other steps in conducting the hypothesis test are the same, except the calculation of test statistic.
Test Your Knowledge
Check your understanding of this lesson with a short quiz.