p-Value in Hypothesis Testing
The p-value is the probability, computed using the test statistic, that measures the support (or lack of support) provided by the sample for the null hypothesis.
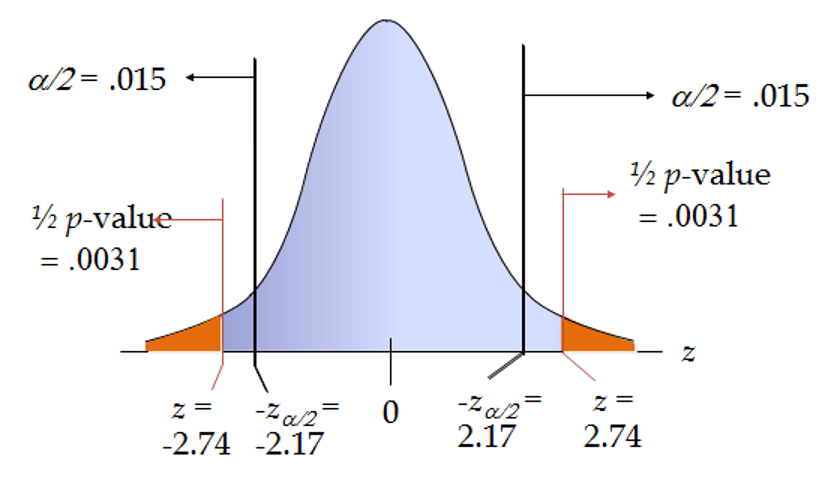
Once we have the test statistic, we look into the z-table to calculate a value greater than or less than that. This will depend on whether it’s a two-tailed or a one-tailed test.
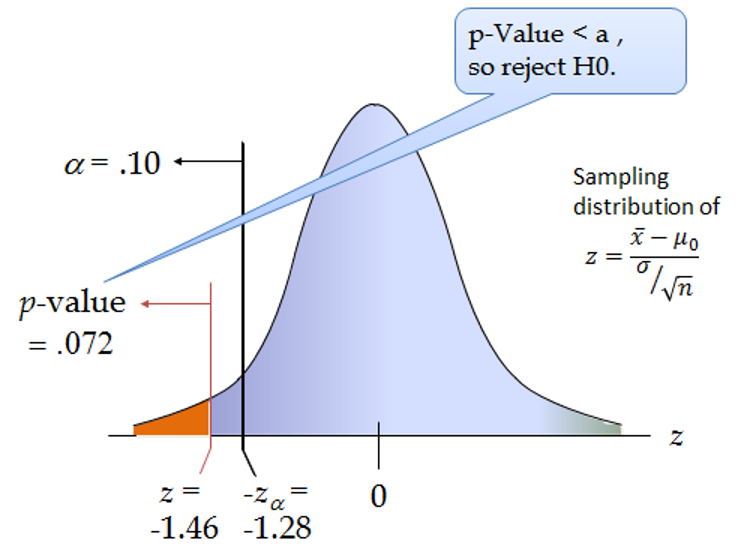
Lower-tailed Test
In a left-tailed hypothesis test, the decision rule will be as follows:

Assume that the level of significance is 10% (a = 0.10)
Under critical value approach, the decision rule will be as follows:
Reject the null hypothesis if test-statistic < -1.28
If the test statistic is -1.46, we will reject the null hypothesis.
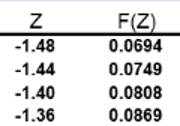
We can calculate the p-value as follows: We will look for the value of F(Z) where Z=-1.46. This gives us p-value = 0.072.
Under p-value approach, the decision rule will be as follows:

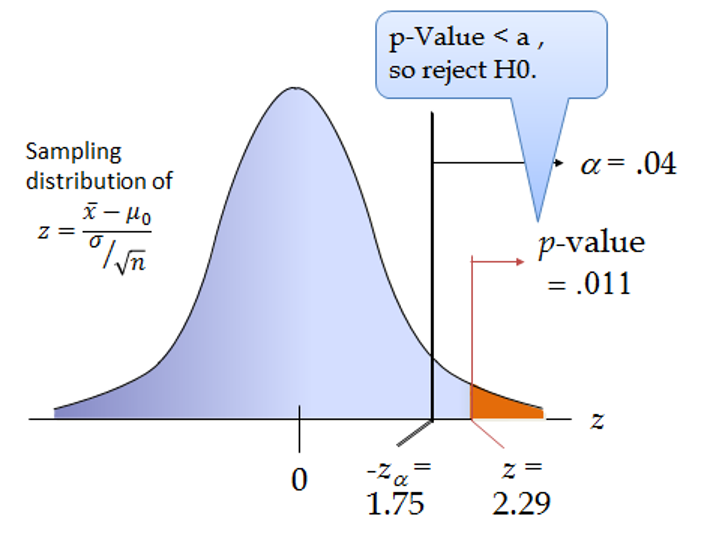
Since p-value (0.072) is less than a (0.10), we reject the null hypothesis. This is illustrated below:
Upper-tailed Test
In a right-tailed hypothesis test, the decision rule will be as follows:

Assume that the level of significance is 4% (a = 0.04)
Test Your Knowledge
Check your understanding of this lesson with a short quiz.