Chi-square Test – Test for value of a single population variance
The tests concerning the value of a population variance of a normally distributed population are called Chi-square tests.
For this test, we calculate a Chi-square distributed test statistic. A chi-square distribution is an asymmetrical distribution. Its shape approaches a normal distribution as the degrees of freedom increases. A chi-square distribution has a lower bound of 0. So, it does not have negative values.
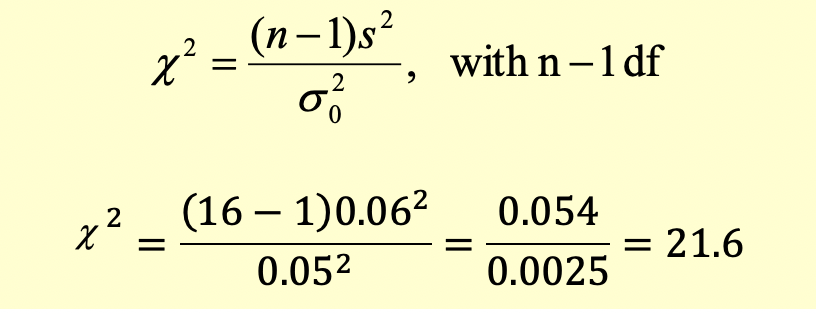
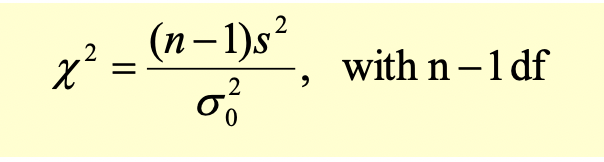
The Chi-square test statistic is calculated as follows:
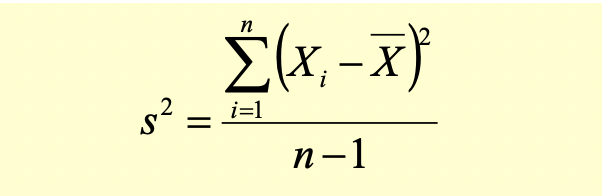
Where the sample variance is:
Example:
A mutual fund claims that the standard deviation of their quarterly returns is 5% based on the historical data.
An investor wants to verify this claim. He collects the sample returns for the past 16 quarters. The standard deviation based on this sample returns data is 6%. At a 5% level of significance can the investor say that the actual standard deviation of claimed returns is indeed 5%.
Step 1: State the hypothesis
Variance of monthly returns = 0.05^2 = 0.0025
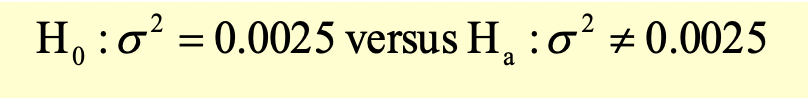
This is a two-tailed test.
Step 2: Identify the appropriate test statistic
The appropriate test statistic for a value of population variance is Chi-square.
Step 3: Specify the significance level
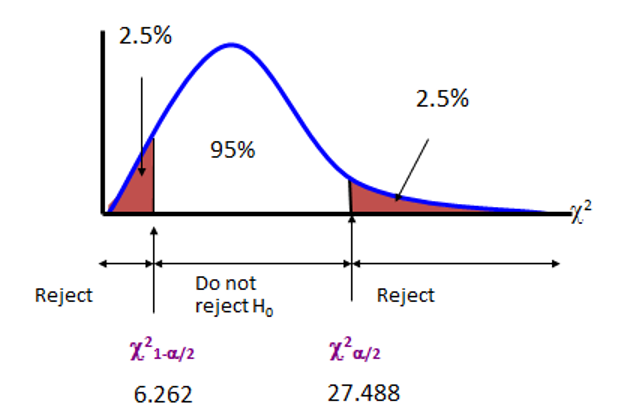
The level of significance is 5%. There is a 5% probability of rejecting a true null hypothesis (Type I error). This is a probability of 2.5% in each tail.
Step 4: State the decision rule
Since it’s a two tailed test, both the values on the left and on the right are rejection regions. The level of significance is 5%, so area of rejection in each tail is 2.5%.
We will use the chi-square table to look for the critical values. For 15 degrees of freedom (16 – 1) and probabilities 0.9750 and 0.025, the critical values are 6.262 and 27.488
Test Your Knowledge
Check your understanding of this lesson with a short quiz.