F-test - Test for the Differences Between Two Population Variances
The tests concerning the differences between two population variances are called F-test. We are testing the equality of two variances.
For this test, we calculate a F-distributed test statistic that follows the F-distribution.
Here also we assume that the samples are normally distributed and are independent.
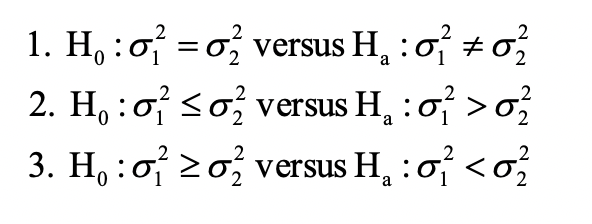
The hypothesis is formed as follows:
Assume we have two samples with n1 and n2 observations. The test statistic for F-test is calculated as follows:
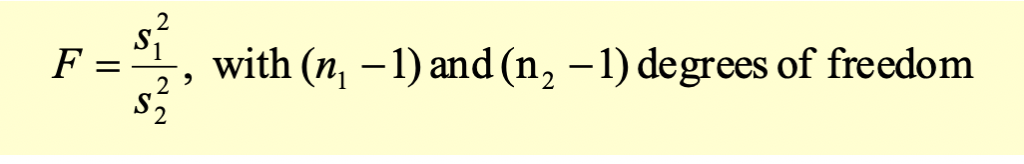
We use the degrees of freedom to identify the critical value from the F-table.
The F distribution is an asymmetric distribution that has a minimum value of 0, but no maximum value. The curve reaches a peak not far to the right of 0, and then gradually approaches the horizontal axis the larger the F value is. The F distribution approaches, but never quite touches the horizontal axis.
All the other steps in conducting the hypothesis test are the same, except the calculation of test statistic.
