Decision Rule in Hypothesis Testing
A decision rule is the rule based on which the null hypothesis is rejected or not rejected.
We first state the hypothesis. Then we determine if it is a one-tailed or a two tailed test. We then specify a significance level, and calculate the test statistic. Now we calculate the critical value. If the test statistic follows a normal distribution, we determine critical value from the standard normal distribution, i.e., the z-statistic. Using the test statistic and the critical value, the decision rule is formulated.
For a 5% level of significance, the decision rules look as follows:
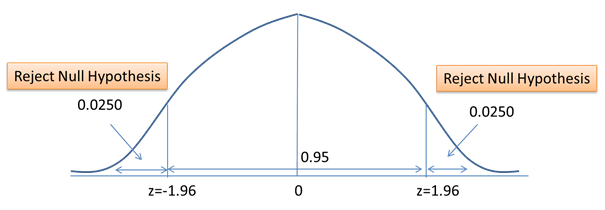
1. H0: θ = θ0 versus Ha: θ ≠ θ0
Reject the null hypothesis if test-statistic > 1.96 or if test-statistic < -1.96.
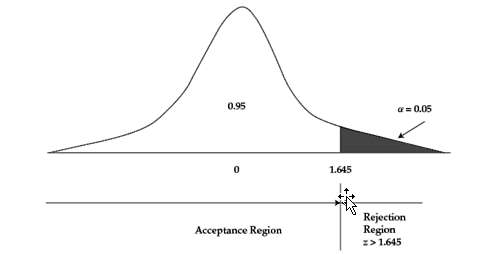
2. H0: θ ≤ θ0 versus Ha: θ > θ0
Reject the null hypothesis if test-statistic > 1.645
3. H0: θ ≥ θ0 versus Ha: θ < θ0
Reject the null hypothesis if test-statistic < -1.645
In our example, the decision rule will be as follows:
Reject the null hypothesis if test-statistic > 1.96 or if test-statistic < -1.96.
Our value of test-statistic was 4, which is greater than 1.96. Therefore, null hypothesis should be rejected. This was a two-tailed test.
The following chart shows the rejection point at 5% significance level for a one-sided test using z-test.
Power of Test
The power of test is the probability of correctly rejecting the null (rejecting the null when it is false).
The power of test = 1 – P(Type II Error)
The following table illustrates the correct decision, Type I error and Type II error.
| H0 is true | H0 is false | |
| H0 is rejected | Type I ErrorSignificance level, a. Probability of Type I error. |
Test Your Knowledge
Check your understanding of this lesson with a short quiz.