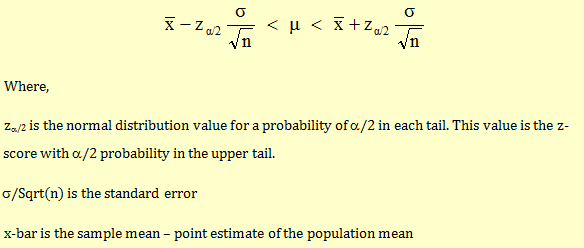
Confidence Interval for a Population mean, with a known Population Variance
We have the following assumptions:
- Population variance σ2 is known
- Population is normally distributed
Under these assumptions, the confidence interval estimate will be given as follows:
Example
Let’s take an example to compute this.
We take a sample of 16 stocks from a large population with a mean return of 5.2%. We know that the population standard deviation is 1.5%.
Calculate the 95% confidence interval for the population mean.
For 95% confidence interval, zα/2 = 1.96
The confidence interval will be:
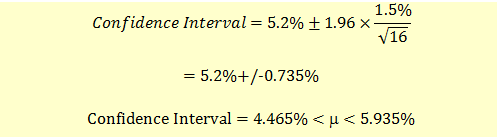
We are 95% confidence that the true mean is between 4.465% and 5.935%.
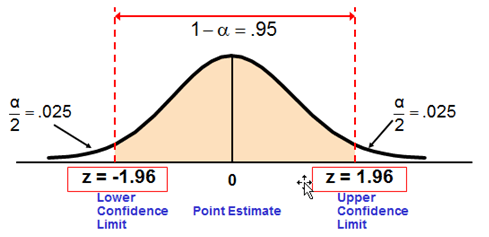
z is obtained from the standard normal distribution table as shown below. F(Z) value is 0.025 at z = -1.96 and F(Z) value is 0.9750 at z = 1.96.
The most commonly used confidence intervals are 90%, 95%, 99% and 99.9%. The z values are given below.
| Confidence Level | Za/2 Value |
| 90% | 1.645 |
| 95% | 1.96 |
| 99% | 2.58 |
| 99.9% | 3.27 |
Test Your Knowledge
Check your understanding of this lesson with a short quiz.