Predictive Modelling: Averaging Results from Multiple Models
Our final model is to combine the result of previous machine learning models and provide a single prediction by averaging probabilities from all previous models.
1predict_loan_status_ensemble = predict_loan_status_logit +
2                               predict_loan_status_svm +
3                               predict_loan_status_rf +
4                               predict_loan_status_xgb
5predict_loan_status_ensemble = predict_loan_status_ensemble / 4
6rocCurve_ensemble = roc(response = data_test$loan_status,
7               predictor = predict_loan_status_ensemble)
8auc_curve = auc(rocCurve_ensemble)
9plot(rocCurve_ensemble,legacy.axes = TRUE,print.auc = TRUE,col="red",main="ROC(Ensemble Avg.)")
10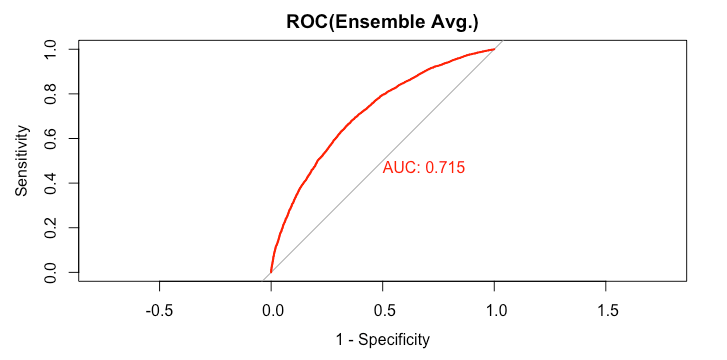
1> rocCurve_ensemble
2
3Call:
4roc.default(response = data_test$loan_status, predictor = predict_loan_status_ensemble)
5
6Data: predict_loan_status_ensemble in 5358 controls (data_test$loan_status Default) < 12602 cases (data_test$loan_status Fully.Paid).
7Area under the curve: 0.7147
8>
91predict_loan_status_label = ifelse(predict_loan_status_ensemble<0.5,"Default","Fully.Paid")
2c = confusionMatrix(predict_loan_status_label,data_test$loan_status,positive="Fully.Paid")
3
4table_perf[5,] = c("Ensemble",
5 round(auc_curve,3),
6 as.numeric(round(c$overall["Accuracy"],3)),
7 as.numeric(round(c$byClass["Sensitivity"],3)),
8 as.numeric(round(c$byClass["Specificity"],3)),
9 as.numeric(round(c$overall["Kappa"],3))
10 )
11We get the following performance:
1> tail(table_perf,1)
2     model   auc accuracy sensitivity specificity kappa
35 Ensemble 0.715     0.65       0.637        0.68 0.275
4>
5