Create a Confusion Matrix in R
A confusion matrix is a tabular representation of Actual vs Predicted values.
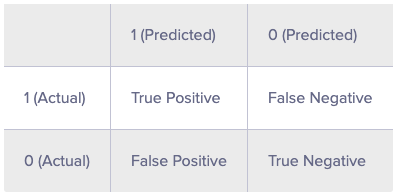
As you can see, the confusion matrix avoids "confusion" by measuring the actual and predicted values in a tabular format. In table above, Positive class = 1 and Negative class = 0. Following are the metrics we can derive from a confusion matrix:
Accuracy - It determines the overall predicted accuracy of the model. It is calculated as Accuracy = (True Positives + True Negatives)/(True Positives + True Negatives + False Positives + False Negatives)
True Positive Rate (TPR) - It indicates how many positive values, out of all the positive values, have been correctly predicted. The formula to calculate the true positive rate is (TP/TP + FN). Also, TPR = 1 - False Negative Rate. It is also known as Sensitivity or Recall.
False Positive Rate (FPR) - It indicates how many negative values, out of all the negative values, have been incorrectly predicted. The formula to calculate the false positive rate is (FP/FP + TN). Also, FPR = 1 - True Negative Rate.
True Negative Rate (TNR) - It indicates how many negative values, out of all the negative values, have been correctly predicted. The formula to calculate the true negative rate is (TN/TN + FP). It is also known as Specificity.
False Negative Rate (FNR) - It indicates how many positive values, out of all the positive values, have been incorrectly predicted. The formula to calculate false negative rate is (FN/FN + TP).
Precision: It indicates how many values, out of all the predicted positive values, are actually positive. It is formulated as:(TP / TP + FP).
F Score: F score is the harmonic mean of precision and recall. It lies between 0 and 1. Higher the value, better the model. It is formulated as 2((precision*recall) / (precision+recall)).
We can create the confusion matrix for our data.
1> confusionMatrix(credit_test$Creditability,pred_value_labels)
2Confusion Matrix and Statistics
3          Reference
4Prediction   0   1
5         0  48  32
6         1  59 161
7               Accuracy : 0.6967
8                 95% CI : (0.6412, 0.7482)
9    No Information Rate : 0.6433
10    P-Value [Acc > NIR] : 0.02975
11                  Kappa : 0.2996
12 Mcnemar's Test P-Value : 0.00642
13            Sensitivity : 0.4486
14            Specificity : 0.8342
15         Pos Pred Value : 0.6000
16         Neg Pred Value : 0.7318
17             Prevalence : 0.3567
18         Detection Rate : 0.1600
19   Detection Prevalence : 0.2667
20      Balanced Accuracy : 0.6414
21       'Positive' Class : 0
22