Calculate Historical Volatility Using EWMA
Volatility is the most commonly used measure of risk. Volatility in this sense can either be historical volatility (one observed from past data), or it could implied volatility (observed from market prices of financial instruments.)
The historical volatility can be calculated in three ways, namely:
- Simple volatility,
- Exponentially Weighted Moving Average (EWMA)
- GARCH
One of the major advantages of EWMA is that it gives more weight to the recent returns while calculating the returns. In this article, we will look at how volatility is calculated using EWMA. So, let’s get started:
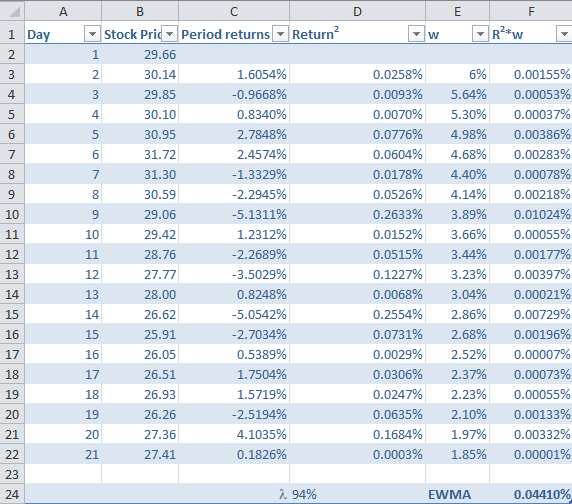
Step 1: Calculate log returns of the price series
If we are looking at the stock prices, we can calculate the daily lognormal returns, using the formula ln(Pi/Pi-1), where P represents each day’s closing stock price. We need to use the natural log because we want the returns to be continuously compounded. We will now have daily returns for the entire price series.
Step 2: Square the returns
The next step is the take the square of long returns. This is actually the calculation of simple variance or volatility represented by the following formula:
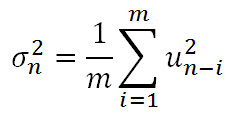
Here, u represents the returns, and m represents the number of days.
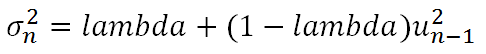
Step 3: Assign weights
Assign weights such that recent returns have higher weight and older returns have lesser weight. For this we need a factor called Lambda (λ), which is a smoothing constant or the persistent parameter. The weights are assigned as (1- λ)λ0. Lambda must be less than 1. Risk metric uses lambda = 94%. The first weight will be (1-0.94) = 6%, the second weight will be 6%*0.94 = 5.64% and so on. In EWMA all the weights sum to 1, however they are declining with a constant ratio of λ.
Step 4: Multiply Returns-squared with the weights
Step 5: Take the summation of R2*w
This is the final EWMA variance. The volatility will be the square root of variance.
The following screenshot shows the calculations.
Test Your Knowledge
Check your understanding of this lesson with a short quiz.