Macroeconomic Equilibrium
We can combine the aggregate demand curve and the aggregate supply curve to determine the macroeconomic equilibrium in the short-run and the long-run. The two graphs are shown below:
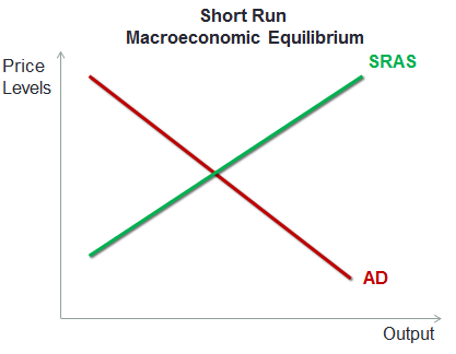
In the short run the equilibrium point is the point where the Aggregate Demand (AD) curve and Short Run Aggregate Supply (SRAS) curve intersect. It reflects the equilibrium output and the price level in the short run.
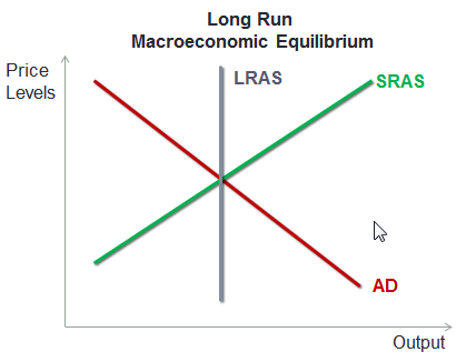
Let’s say that the economy is not in equilibrium and supply is more (somewhere towards the upper right side on the green line). In that case the price levels the producers expect are higher and at that price level the supply is much more than the demand. Then the producers will curtail their production and we will move back towards the equilibrium point shown above.In the long run, the macroeconomic equilibrium point is the point where the Aggregate Demand (AD) curve intersects with the Long Run Aggregate Supply (LRAS) curve. Even the SRAS intersects at the same point. The output level is the potential GDP at full employment.
Test Your Knowledge
Check your understanding of this lesson with a short quiz.