Finance Train LogoFinance Train
Learning LibraryTemplatesBlog
Data Science Bundle
Finance TrainFinance Train
Learning LibraryTemplatesBlog
Data Science Bundle
Lesson 13 of 17

Economic Growth and Inflation

We can explain economic growth and inflation using the Aggregate Demand and Long Run Aggregate Supply curves.

Economic growth is the persistent growth in potential GDP, while inflation is the persistent increase in general prices as shown in the graph below:
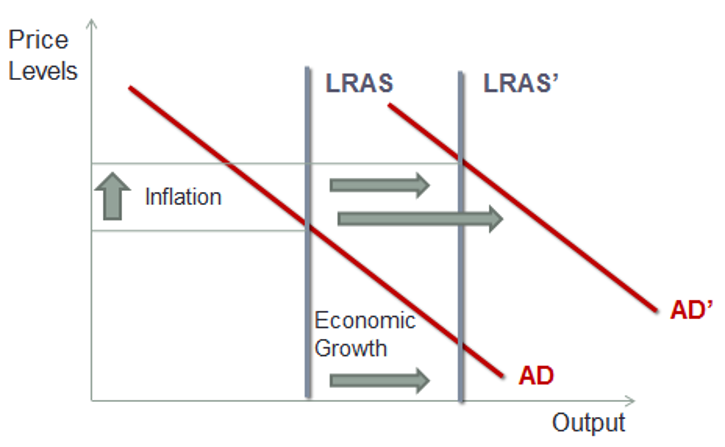
As you can see both AD and LRAS have shifted to the right. Increase in LRAS brings economic growth. This happens due to increased labour, more capital, or better technology. However, there is a bigger increase in Aggregate Demand (AD), which causes inflation.

Previous Lesson

Macroeconomic Equilibrium

Next Lesson

Business Cycle and Economics

Back to ebook

Aggregate Output, Prices and Economic Growth

17 lessons

Lessons

1
Gross Domestic Product
2
Methods of Calculating GDP
3
Nominal Vs. Real GDP
4
GDP, National Income, and Personal Income
5
Relationship Between Saving, Investment, Fiscal Balance, and Trade Balance
6
The IS Curve
7
The LM Curve
8
Aggregate Demand Curve
9
Aggregate Supply Curve
10
Shifts in Aggregate Demand Curve
11
Shifts in Supply Curve
12
Macroeconomic Equilibrium
13
Economic Growth and Inflation
14
Business Cycle and Economics
15
Impact of Changes in Aggregate Supply and Demand
16
Sources, Measurement, and Sustainability of Economic Growth
17
The Production Function

Quizzes

Aggregate Output, Prices, and Economic Growth
Finance Train

Learn data science and AI skills for finance through practical courses and tutorials.

Learn

  • Learning Library
  • Course Directory
  • Blog

Resources

  • Templates & Downloads
  • Tools
  • Tables
  • Calculators

Company

  • About
  • Contact
  • Privacy
  • Terms

© 2026 Finance Train. All rights reserved.