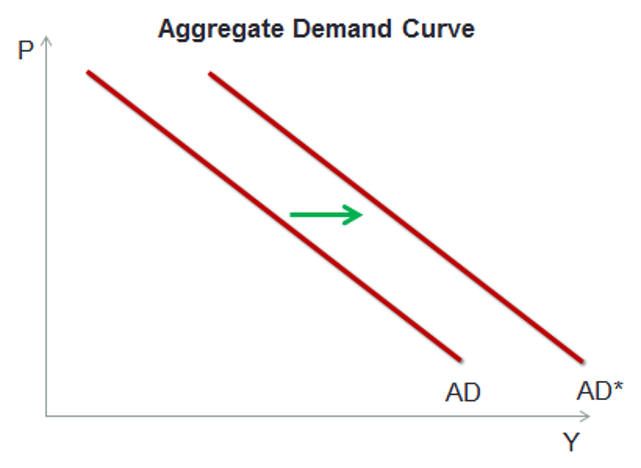
Shifts in Aggregate Demand Curve
Aggregate demand is the sum of all expenditure in the economy over a period of time. An increase in aggregate demand shifts the aggregate demand curve to the right indicating that at any given price level, the total quantity of goods and services demanded in the economy is now greater.
Recall that from the expenditure side, the GDP is represented as below:
GDP = C + I + G + (X – M)
This is what comprises aggregate demand.
Any change in the price levels is a movement along the aggregate demand curve and does not cause the demand curve to shift. The shift can be caused by a change in any of the above factors.
- A change in consumption can lead to a shift in aggregate demand curve. Consumption is a function of disposable income. An increase in disposable income will lead to an increase in consumption, which will lead to an increase in aggregate demand.
- A change in investments will also shift the aggregate demand curve. Investments depend on interest rates. If interest rates decrease, investments will increase as the cost of capital for the firms decrease. An increase in investment will increase the aggregate demand.
- The third factor affecting the shift in aggregate demand curve is the government spending (G). The government spending is changed through fiscal policy. An increase in government spending increases aggregate demand and vice versa.
- Net exports (X – M) will also affect the aggregate demand. An increase in exports or a decrease in imports will increase the aggregate demand and vice versa. Exports and imports are affected by policies that affect real exchange rates. Any policy that increases the real exchange rate will cause the net exports to fall leading to a decrease in aggregate demand and shift the aggregate demand curve to the left. The change in export and import can also happen for reasons other than change in exchange rates.
- Higher capacity utilization: Companies can increase their capacity utilization and produce more. In such a case they will invest more in capital equipment, thereby increasing the investments which results in an increase in aggregate demand.
- Expansionary monetary policy: In an expansionary monetary policy, the money supply increases, banks lend more, and interest rates fall. This increases investments by corporates leading to an increase in aggregate demand.
