Importing Data from Excel in R
Microsoft Excel is another tool which is commonly used for data analysis. There are many R packages that can be used to interact with Excel. Once such package is readxl which was developed by Hadley Wickham.
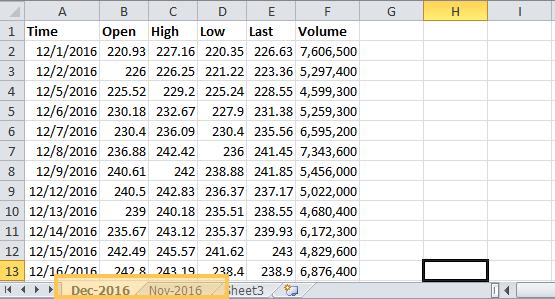
An Excel file contains tabular data in multiple sheets. For this lesson, we have an excel sheet named stock-prices.xlsx (Downloadable above) that contains stock price data for December 2016 and November 2016 in two different sheets labeled - 'Dec-2016' and 'Nov-2016'.
It is generally a good idea to first explore your data by directly opening it in MS Excel before you import it in R. Now that we know what data we are importing, let's look at how we can import it using readxl.
readxl()
We will use two functions from readxl package:
excel_sheets()is used to get a list of sheets in the excel fileread_excel()is used to actually import the data from an excel sheet
These functions support both .xls and .xlsx file formats.
Install and Load read.xl() Package
The first thing we need to do is to install and load the desired package.
1> install.packages("readxl")
2> library(readxl)
3
Importing Data
Now that the readxl package is loaded in our R session, we can use the functions to read the data.
We will first place the excel sheet into our working directory so that it is easy to refer to in the functions. The dir() function can be used to confirm that the file is in the working directory. The function excel_sheets() can be used to get a list of all sheets in our excel file. To use the function simply pass the file name to the function and it will return a character vector with a list of sheet names.
1> dir()
2[1] "GS-Stock-Prices.txt" "stock-prices.xlsx"   "top-100-stocks.csv"
3> excel_sheets("stock-prices.xlsx")
4[1] "Dec-2016" "Nov-2016" "Sheet3"
5>
6
We can now use the read_excel() function to import the data from an excel sheet. If we just pass the excel file name to the function, it will import data from the first sheet by default. The imported data is in the form of a tibble. If we want to load data from a specific sheet we can specify the sheet name or the sheet index in the sheet argument.
1# The following function will load data from first sheet
2read_excel("stock-prices.xlsx")
3# The following two commands will load data from the second sheet
4read_excel("stock-prices.xlsx", sheet=2)
5read_excel("stock-prices.xlsx", sheet="Nov-2016")
6
Once the data is imported, we can explore it using the standard R functions.
1> stockdata <- read_excel("stock-prices.xlsx", sheet="Nov-2016")
2> str(stockdata)
3Classes ‘tbl_df’, ‘tbl’ and 'data.frame':    21 obs. of  6 variables:
4 $ Time  : POSIXct, format: "2016-11-01" "2016-11-02" ...
5 $ Open  : num  179 177 177 176 179 ...
6 $ High  : num  179 178 178 177 182 ...
7 $ Low   : num  177 176 176 175 179 ...
8 $ Last  : num  178 177 176 176 181 ...
9 $ Volume: num  2900600 2104700 1972700 1846400 3338700 ...
10> summary(stockdata)
11      Time                          Open            High            Low
12 Min.   :2016-11-01 00:00:00   Min.   :176.3   Min.   :177.3   Min.   :174.7
13 1st Qu.:2016-11-08 00:00:00   1st Qu.:180.1   1st Qu.:182.7   1st Qu.:179.0
14 Median :2016-11-15 00:00:00   Median :206.3   Median :209.7   Median :204.8
15 Mean   :2016-11-14 21:42:51   Mean   :198.1   Mean   :201.3   Mean   :197.2
16 3rd Qu.:2016-11-22 00:00:00   3rd Qu.:210.0   3rd Qu.:211.9   3rd Qu.:209.6
17 Max.   :2016-11-30 00:00:00   Max.   :215.2   Max.   :220.8   Max.   :215.0
18      Last           Volume
19 Min.   :175.9   Min.   : 1846400
20 1st Qu.:181.9   1st Qu.: 2646100
21 Median :209.2   Median : 3338700
22 Mean   :200.1   Mean   : 4306352
23 3rd Qu.:211.1   3rd Qu.: 5276100
24 Max.   :219.3   Max.   :11345400
25>
26
xlsx
We can also use the xlsx package to access Excel files. The first row should contain variable/column names.
1# read in the first worksheet from the workbook stock-prices.xlsx
2# first row contains variable names
3library(xlsx)
4stock_data <- read.xlsx("stock-prices.xlsx", 1)
5# read in the worksheet named Nov-2016
6mydata <- read.xlsx("stock-prices.xlsx", sheetName = "Nov-2016")
7
The imported data is loaded as a data frame.
gdata
Another alternative package for working with Excel data in R is the gdata package which is maintained by Gregory Warnes. gdata is actually an entire suite of tools for data manipulation. The package makes handling and management of data very convenient in R. In the gdata package the function we use to read Excel data is the read.xls() function. By default it only supports XLS files. However, the support for .xlsx files can be incorporated by simply installing a driver.
Internally the read.xls() makes use of the read.table() function to import the data as a data frame. So, all the arguments for read.table() are available for us to use while importing data from Excel using read.xls().
The gdata package requires perl interpreter to be installed on the system. Without that the function will not run.
