• Skip to primary navigation
  • Skip to main content
  • Skip to primary sidebar
  • Skip to footer
Finance Train

Finance Train

High Quality tutorials for finance, risk, data science

  • Home
  • Data Science
  • CFA® Exam
  • PRM Exam
  • Tutorials
  • Careers
  • Products
  • Login

Aggregate Demand Curve

CFA® Exam Level 1, Economics

Aggregate Output, Prices and Economic Growth Aggregate Demand Curve

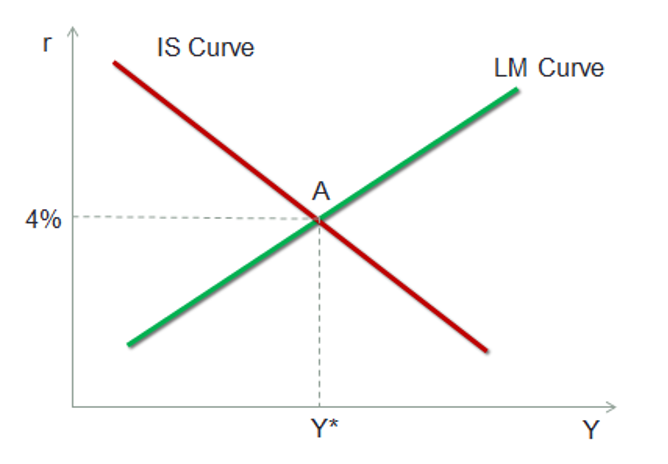
We can use the IS curve and the LM curve to derive the aggregate demand curve. The following curve shows the IS curve and the LM curve with equilibrium at point A where IS intersects with LM. We have assumed that at this equilibrium point the real interest rates are 4%.

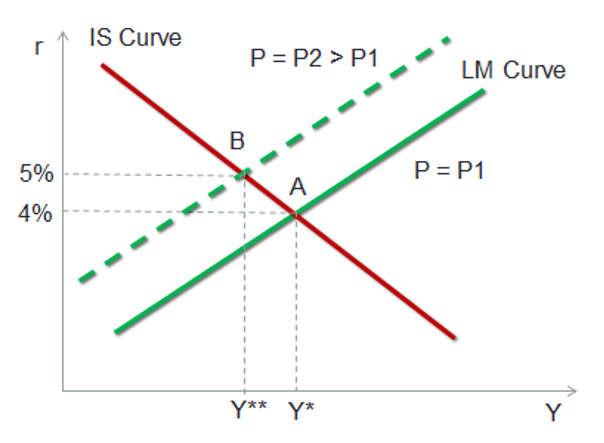
Let’s assume that at equilibrium level A, the price levels are P1. What will be the impact of increase in price levels to P2? If price levels rise, the real money supply will decrease. Recall that real money supply M/P will decrease if P increases. This will result in a shift of the LM curve to the left. The new equilibrium point will now be B, with a higher real interest rate level and a lower income level, as shown in the graph below.

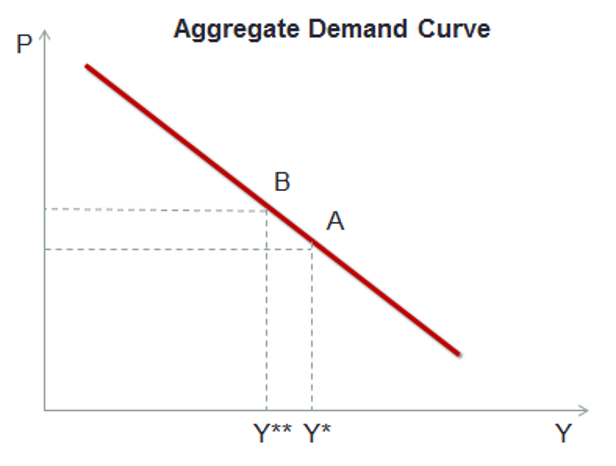
The aggregate demand curve shows the relationship between the quantity of real output demanded (Same as real income) and the price levels. In the above graph we can observe this relationship, i.e., when price levels go up, the real income goes down. The prices and income levels are inversely proportional to each other, as shown in the graph below:

Previous Lesson
Back to Course
Next Lesson

Primary Sidebar

In this Course

Course Home
Gross Domestic Product
Methods of Calculating GDP
Nominal Vs. Real GDP
GDP, National Income, and Personal Income
Relationship Between Saving, Investment, Fiscal Balance, and Trade Balance
The IS Curve
The LM Curve
Aggregate Demand Curve
Aggregate Supply Curve
Shifts in Aggregate Demand Curve
Shifts in Supply Curve
Macroeconomic Equilibrium
Economic Growth and Inflation
Business Cycle and Economics
Impact of Changes in Aggregate Supply and Demand
Sources, Measurement, and Sustainability of Economic Growth
The Production Function
Return to Aggregate Output, Prices and Economic Growth

Latest Tutorials

    • Data Visualization with R
    • Derivatives with R
    • Machine Learning in Finance Using Python
    • Credit Risk Modelling in R
    • Quantitative Trading Strategies in R
    • Financial Time Series Analysis in R
    • VaR Mapping
    • Option Valuation
    • Financial Reporting Standards
    • Fraud
Facebook Group

Membership

Unlock full access to Finance Train and see the entire library of member-only content and resources.

Subscribe

Footer

Recent Posts

  • How to Improve your Financial Health
  • CFA® Exam Overview and Guidelines (Updated for 2021)
  • Changing Themes (Look and Feel) in ggplot2 in R
  • Coordinates in ggplot2 in R
  • Facets for ggplot2 Charts in R (Faceting Layer)

Products

  • Level I Authority for CFA® Exam
  • CFA Level I Practice Questions
  • CFA Level I Mock Exam
  • Level II Question Bank for CFA® Exam
  • PRM Exam 1 Practice Question Bank
  • All Products

Quick Links

  • Privacy Policy
  • Contact Us

CFA Institute does not endorse, promote or warrant the accuracy or quality of Finance Train. CFA® and Chartered Financial Analyst® are registered trademarks owned by CFA Institute.

Copyright © 2021 Finance Train. All rights reserved.

  • About Us
  • Privacy Policy
  • Contact Us