While R comes with a neat console that you can use for all your R programming needs, you can compliment it with RStudio which is a Gui built on top of R and makes it very easy to manage your programming requirements.
You can download RStudio from the following link:
https://www.rstudio.com/products/rstudio/download/
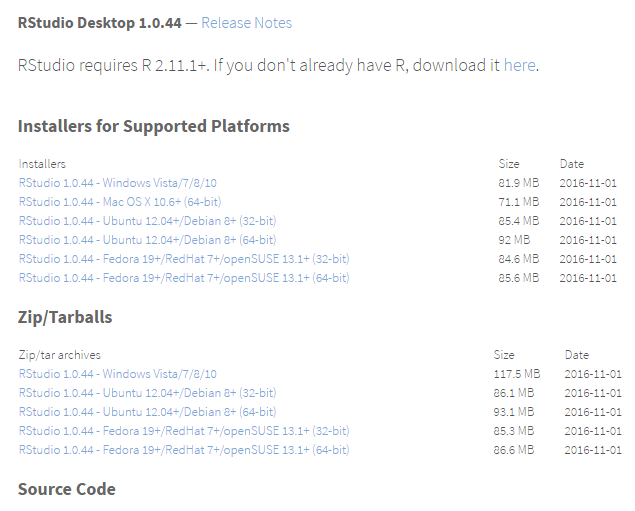
On the page you will come across multiple choices for downloading the software.

So, among all the choices available, you will need to download RStudio Desktop with Personal License.
When you click the download button, it will present you with a choice of download files. You must download the file suitable for your operating system.
It is preferred to download Installers rather than Zip/Tarballs or Source Code.
Click the relevant file and the download will begin.
Once the installer is downloaded, click on it and install it. Follow the onscreen instructions to complete the installation. Once installed, open the application and now you’re running RStudio.
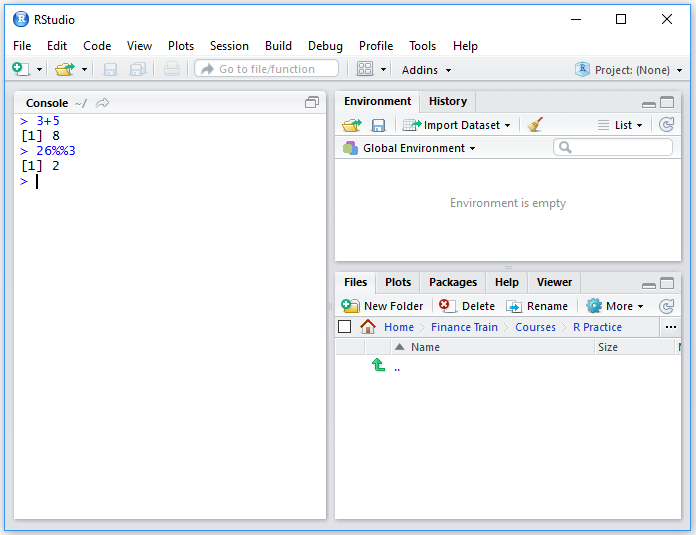
You can quickly try some arithmetic to get the idea of how to use the interface.
For example:
CTRL+L to clear the console3+5 to calculate the sum of 3 and 526%%3 to calculate the 26 modulo 3.Your RStudio screen should now look something like this:

RStudio being a Gui makes working with R very user-friendly and allows you to execute basic commans without writing commands manually. This includes things like opening a script, import/export .csv files, manage R packages, get help, etc. In general, it accelerates and simplifies these general tasks.
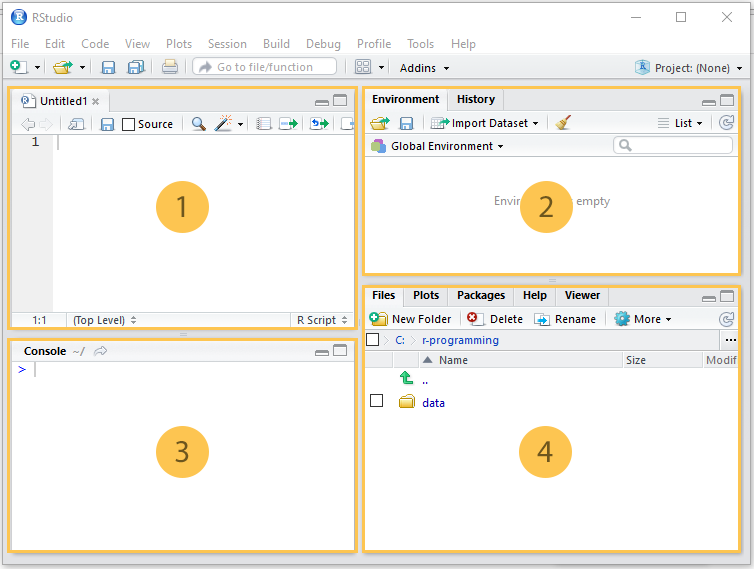
Let’s take a look at the RStudio screen and how it is organized.

This tab shows you all the files you have saved in your RStudio account. The buttons across the top of the tab allow you to upload additional files, delete files, rename files, and many more functions.
When you run code in the Console that creates a plot, the Plots tab will be automatically selected. Any time you want to view plots, you can select this tab manually, but it will be selected when you run plot code. Notice the arrow buttons at the top left of the pane; these allow you to scroll through all the plots you have created in a session.
This tab allows you to see the list of all the packages (add-ons to the R code) you have access to, and which are loaded in already.
This tab will be automatically selected whenever you run help code in the Console, but you can access it at any time by clicking on the tab.
help(plot)
RStudio includes a Viewer pane that can be used to view local web content. We will not be using this till much later in the course.
As we go along in the course, you will get more familiar with RStudio and various features it offers.
When you first start RStudio, you may not see the script window. You can create a new script window, by just clicking the ‘New Script’ button, as shown below:
