Calculating Probabilities Using Standard Normal Distribution
Once we have the z-scores, we can use the standard normal table to calculate the probabilities. The standard normal table shows the area (as a proportion, which can be translated into a percentage) under the standard normal curve corresponding to any Z-score or its fraction, i.e., the probability of observing a z-value that is less than the given value.
The following z-table shows the probabilities for z values ranging between – 3 and 3.
In the above table, F(Z) is the probability that a variable from a standard normal distribution will be less than or equal to Z.
Example 1: Finding Probability
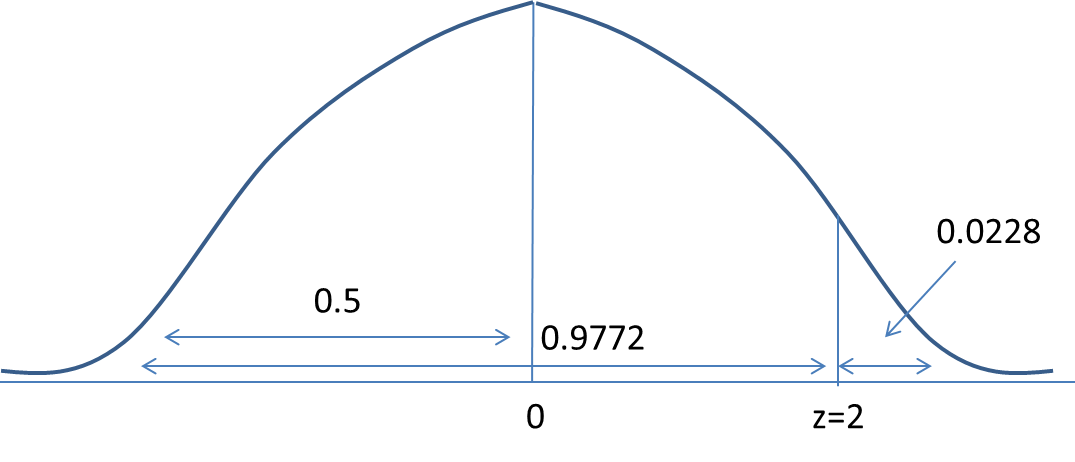
Let’s continue with our earlier example. The dividends paid by a company every year are normally distributed with a mean of $10 and a standard deviation of $2. If the company pays a dividend of $14 this year, its z-score is 2 indicating that the current dividends are 2 standard deviations above the mean.
We can look up the z-score of 2 in the above table. Look for a z-score in the first column, and note the corresponding F(Z) value. For a z-score of 2, F(Z) = 0.9772. This means that 97.72% of observations lie below a z-score of 2 (2 standard deviations). We can also interpret this as – there is a 97.72% probability that the dividends paid by the company will be below $14.
Example 2: Finding Probability
Compute p (-1.2 < Z < 0.80)
We are required to calculate the probability of z being between -1.2 and 0.80. This is demonstrated below:
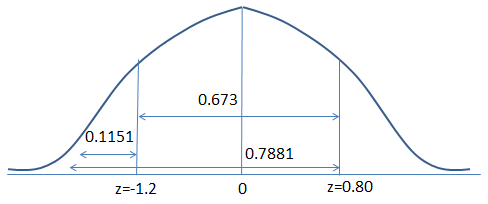
From the table, we can observe that p(z=0.80) = 0.7881 and p(z=-1.2) = 0.1151

Test Your Knowledge
Check your understanding of this lesson with a short quiz.