
Discover how to scale standard deviation to different time horizons. We know that risk increases with time: The longer we hold a position, the greater the potential loss. Following is a simple approximation to help you scale volatility estimates to a longer (or shorter) -time horizon. Note, however, that this is just an approximation.
Volatility (or standard deviation) may be roughly approximated by scaling by the square root of time, assuming independent price moves. Note that we use the number of trading days (5 for 1 week, 21 for 1 month), as opposed to actual days to scale volatility.
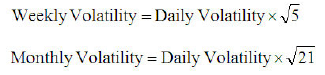
Square Root of Time Scaling Rule
Intuitively, we can picture the square root of time scaling rule as follows: Imagine Zeus flipping coins every day—if heads come up, the stock market goes up, if tails come up, the stock market falls. Assuming 1 % daily volatility (or standard deviation) in the markets, what would you expect weekly volatility to be?
We could just guess and multiply 1 % by 5 to get 5%. However, it is unlikely (1/32 chance) that we’ll have 5 bad days in a row, because every day’s coin flip is independent—it has no memory of the past. An accurate prediction of a 5-day risk would 1 % * square root of 5 = 2.24% (but only if Zeus is not biased!).
Assumptions
Square root of time scaling assumes independent price moves and constant volatility:
- If there is significant mean reversion, time scaling will overestimate volatility (mean reversion is a statistical tendency to revert to a long-term average).
- If there is significant trending, time scaling will underestimate volatility (trending is a statistical tendency to keep moving in one direction).
- If volatility changes over time, or there are jumps, time scaling will be inaccurate.