Solvency Ratios
Solvency ratios measure a business’s ability to meet its obligations in the long-term based on its overall debt level and earnings capacity. These ratios are important because failure to meet its interest obligation could put a firm into bankruptcy. They are also called leverage ratios. Solvency ratios include debt ratios and coverage ratios.
Debt Asset Ratio
This ratio measures what percentage of assets is financed with debt. An increase in this ratio indicates that the company is relying more on debt as a source of financing its assets. A decrease in this ratio indicates less reliance on financing.

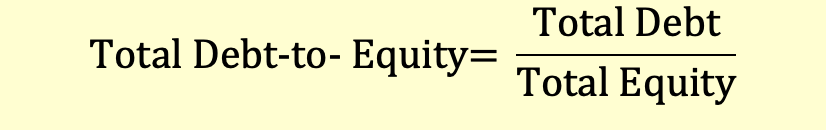
Debt Equity Ratio
This ratio shows the extent the company is leveraged. If the company has too much debt, any dip in business may result in the owner losing its equity or put the company in a position wherein it cannot service its debt. Alternatively, if the debt quotient is small, it probably means the company is not putting enough capital to work.
Factors that affect this ratio are:
- Additional working capital can be put to use to increase profits.
- Component of debt if it is short term or long term. This will determine the payback period.
- Interest rate of the debt. Short term creditor debt is low compared to long term debt.
- Level of profitability in the industry. A low margin industry cannot afford high cost debt, unlike a high profit margin industry.
Debt-to-Capital Ratio
Debt-to-capital ratio is the ratio of total debt to total capital.

A high debt-to-capital ratio indicates that a high proportion of a company's capital is comprised of debt which makes it riskier for the shareholders.
Financial Leverage
Also called leverage ratio, this ratio measures the financial leverage of a company.

A higher financial leverage indicates more usage of debt, and higher risk for shareholders as well as bondholders. While analyzing this ratio, it is important to understand what kind of business the firm is in. A fairly steady company can probably take on large amounts of debt without too much risk. On the other hand for a company in a cyclical business an investor should be vary of a high leverage ratio. A financial leverage ratio of 2.1 is fairly conservative, even for a fast growing retailer. It’s when we see ratios of 4, 5 or more that companies start to get really risky.
Test Your Knowledge
Check your understanding of this lesson with a short quiz.

