Ask questions about this lesson and get instant answers.
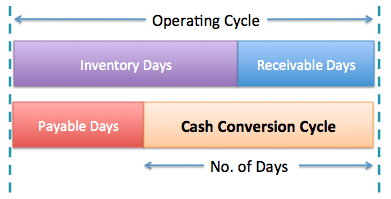
Cash Conversion Cycle is an important concept in liquidity analysis. The cash conversion cycle indicates the time (no. of days) it takes for the cash invested in the business to be converted back to cash. In other words it is the total time taken to sell its inventory, collect the receivables, and pay the creditors.
The Cash Conversion Cycle (also called the Net Operating Cycle) is measured as follows:
CCC = DOH + DSO – DPO
The Days of Inventory at Hand (DOH) specifies how many days worth of inventory the company had in hand. For example, DOH of 15 days means that the company had 36 days of inventory at hand during the period.
DSO stands for Days of Sales Outstanding. A DSO of 30 means that on average the company had 30 days worth of sales outstanding (yet to be collected).
DPO stands for Days of Payable Outstanding. Number of days of payable of 25 means that on average the company takes 25 days to pay its creditors.
Using the above figures, the CCC will be:
CCC = 15 + 30 – 25 = 20
20 days is the time between the cash outlay and the cash received.
If CCC is negative, it indicates that the company has excess cash to invest. A CC of -10 indicates that the company has excess cash to invest for 10 days.
Graphical Representation

Analysis
The cash conversion cycle tells more about the liquidity position of a company than the current or quick ratio.
A low CCC indicates that the company has high liquidity, and that the company will have to fund its inventory and receivables for a shorter period. While looking at the trend of CCC over a period of time, a decreasing trend is positive, as it indicates that the cash conversion cycle is shortening, i.e., it is able to convert its inputs to cash faster. A short cash conversion cycle reduces the firm’s cost.
A firm with the least amount of inventory possible, the least amount of accounts receivable and the greatest amount of accounts payable will have the shortest CCC. However, there are costs associated with each element and the firm needs to take a balanced approach so as not to hurt the business. For example, with a strict credit policy, a company can reduce its account receivables, but may end up hurting its sales. On the other hand, a liberal credit policy may help improve sales, but will result in higher level of account receivables and even bad debt.