How to Calculate Skewness and Kurtosis in R
3 min read
Skewness and Kurtosis are two important statistics that tell us about the shape of a distribution. While skewness tells us how skewed a distribution is to the left or right, kurtosis measures the distribution's 'peakedness,' or whether it is heavy-tailed or light-tailed. Learn more about the concepts of skewness and kurtosis.
In this article, we will learn how to calculate the skewness and kurtosis of a dataset in R.
Dataset
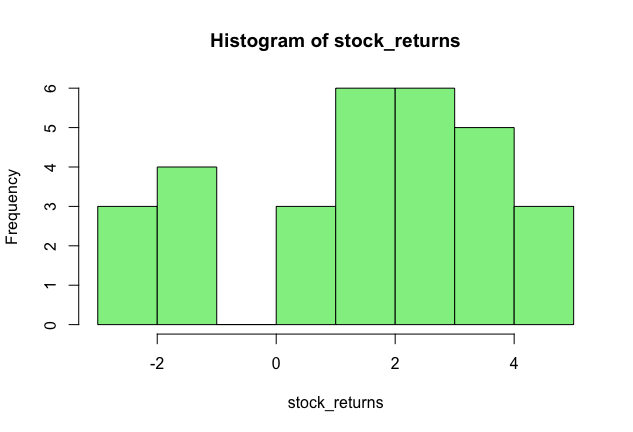
Let’s take the example of the daily stock returns of a stock over the past 30 days.
1 stock_returns <- c(4, 3, -1, 2, 4,