
Reversal Chart Patterns: Rising and Falling Wedge
In the Chart Patterns Overview, we discussed that reversal chart patterns signal the ending on an ongoing trend, i.e., they signify a reversal of asset’s price direction.
In this article, we will discuss the two popular reversal patterns, namely, Rising and Falling Wedge.
The wedge pattern is a commonly found pattern in security prices. It is characterized by a gradually contracting range of security price in an upward or a downward direction. During the time of the formation, the prices oscillate up and down between a range, and this price range keeps reducing. An upward sloping wedge is known as Rising wedge, while the downward sloping wedge is known as Falling wedge.
A rising wedge is formed during an uptrend, and is used to predict the price movement from an uptrend to a downtrend. A falling wedge is formed during a downtrend, and is used to predict the price movement from a downtrend to an uptrend. The wedge pattern is depicted below:
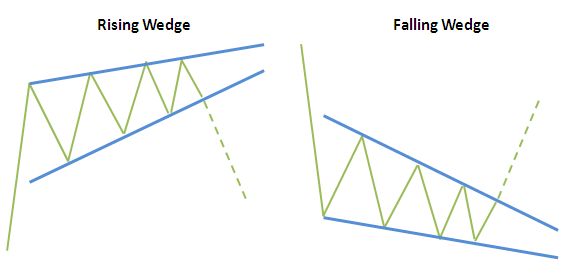
Some of the important characteristics of the wedge pattern are listed below:
- A falling wedge is bullish in nature signaling a reversal of trend from downtrend to uptrend. The opposite is the case for rising wedges, i.e., it is bearish in nature.
- In the falling wedge the upper trend line (the resistance), has a greater slope than the bottom trend line (the support).
- The rising wedge pattern is considered complete, when the price breaks out below the bottom trend line, i.e., the sellers have taken control.
- The falling wedge pattern is considered complete, when the price breaks out above the top trend line, i.e., buyers have taken control of the security.
- The strength of the wedge is judged by how many time the price movement tests the support and resistance trend line. The more number of times it tests the trend lines, the stronger is the pattern signal.