Continuation Chart Patterns: Rectangles

In the Chart Patterns Overview, we discussed that continuation chart patterns signal that the ongoing trend will continue for some time. This means that after the formation, the price movement will continue to follow the same trend as it was before the formation.

Rectangles are common continuation pattern. They suggest that the prices will continue to move in the same direction as it was before the pattern was formed. A rectangle is like a period of consolidation. The traders are indecisive about the security. The prices start moving upwards and downwards, bound by parallel support and resistance trend lines. There are equal buyers and sellers, and the price is tested against the trend lines multiple times. This continues for around 3 weeks (or even more) after which the prices start moving towards the prior direction. The rectangles are also seen during intra-day trading.
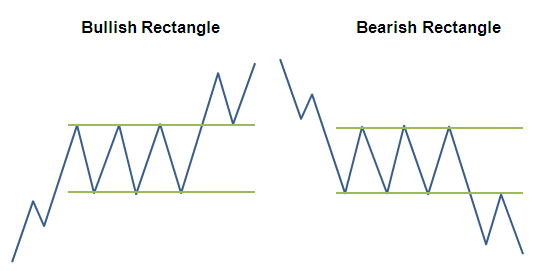
The rectangle pattern formed in an uptrend is called bullish rectangle, while the rectangle pattern formed during a downtrend is called bearish rectangle.

During the rectangle patterns, the volumes generally dive, however, they increase quite a bit during the breakout. The rectangle is generally formed in a very narrow price range.

You may find these interesting

Related Downloads

Finance Train Premium
Accelerate your finance career with cutting-edge data skills.
Join Finance Train Premium for unlimited access to a growing library of ebooks, projects and code examples covering financial modeling, data analysis, data science, machine learning, algorithmic trading strategies, and more applied to real-world finance scenarios.
I WANT TO JOIN
JOIN 30,000 DATA PROFESSIONALS

Free Guides - Getting Started with R and Python

Enter your name and email address below and we will email you the guides for R programming and Python.

Data Science in Finance: 9-Book Bundle

Data Science in Finance Book Bundle

Master R and Python for financial data science with our comprehensive bundle of 9 ebooks.

What's Included:

  • Getting Started with R
  • R Programming for Data Science
  • Data Visualization with R
  • Financial Time Series Analysis with R
  • Quantitative Trading Strategies with R
  • Derivatives with R
  • Credit Risk Modelling With R
  • Python for Data Science
  • Machine Learning in Finance using Python

Each book comes with PDFs, detailed explanations, step-by-step instructions, data files, and complete downloadable R code for all examples.