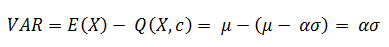
Properties of Normal Distribution
Definition
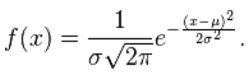
It is one of the most important continuous probability distributions which finds wide applications in real life by describing variables that display randomness. The distribution is characterized by bell curve which is more weight in the center and tapers off on either side which means it has tails on either side. It takes only two moments i.e. the mean µ and the variance σ2 to describe this function and is therefore a parametric function.
The mean gives more information about the location and the variance gives an idea of how dispersed the values are.
The density function is given as follows:
Standard Normal Distribution
If the mean of the normal distribution is 0 and the variance is set to 1 then we get the standard normal density distribution function which is symmetrical around the mean. In other words the mean and mode of this function are the same as the median. The skewness of this distribution is zero and the kurtosis has a value of 3. The variable which represents this distribution is called the standard normal variable ε.
The standard normal distribution is depicted by the graph below:
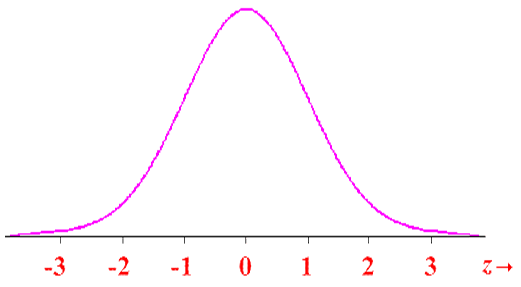
The area under this graph for the range of values of ε from -2 to +2 represents 95% of the distribution. For the value range from -1 to +1 the area represents 68% of the distribution. A table that gives the values of the standard normal variable against the percentage of the distribution is called the standard normal table and the percentage number is called the confidence level in finance.
Most financial variables display this characteristic and the distribution plays a key role in this field. One of the most famous applications is in the Black Scholes pricing model where the cumulative standard normal density function is used to derive the prices of options.
The normal variable is derived from the standard normal by the following definition:
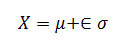
And this has the desired moments.
Test Your Knowledge
Check your understanding of this lesson with a short quiz.