- Weighted Average Cost of Capital (WACC)
- Methods of Calculating Weights in WACC
- Applications of Cost of Capital
- Weighted Average Cost of Capital (WACC) - Practical Example and Issues
- Calculating Cost of Debt: YTM and Debt-Rating Approach
- Issues in Estimating Cost of Debt
- Estimating the Cost of Preferred Stock
- Estimating the Cost of Common Stock
- Calculating Beta Using Market Model Regression (Slope)
- Calculating Beta Using Pure Play Method
- Estimating the Country Risk (Country Equity Premium)
- Marginal Cost of Capital (MCC) Schedule
- Flotation Costs and WACC
Marginal Cost of Capital (MCC) Schedule
MCC Schedule is a graph that relates the firm’s weighted average of each dollar of capital to the total amount of new capital raised.
It reflects changing costs depending on amounts of capital raised. As more funds are raised, the cost of various sources of capital can change because of various reasons:
The firm may have existing debt with a bond covenant that restricts the company from issuing debt with similar seniority as existing debt.
Debt incurrence test may restrict a company ’ s ability to incur additional debt at the same seniority based on one or more financial tests or conditions.
As the company experiences deviations from the target capital structure, the marginal cost of capital may increase, reflecting these deviations.
An additional amount of capital that changes the WACC is referred to as a break point. This is the point at which the cost of one of the sources of capital changes.
The break point is calculated using the following formula.
Break Point = Amount of Capital at which Sources Cost of Capital Changes/Proportion of New Capital Raised from the Source
Example
The following capital structure data is available:
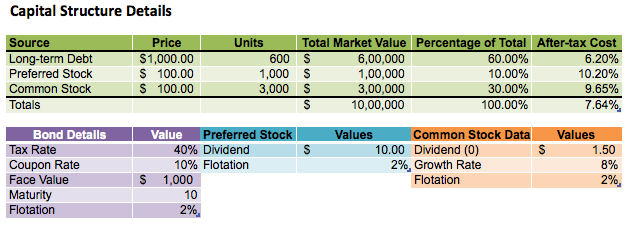
The MCC schedule will look as follows:
Lesson Resources
Related Downloads
Related Quizzes
Data Science in Finance: 9-Book Bundle
Master R and Python for financial data science with our comprehensive bundle of 9 ebooks.
What's Included:
- Getting Started with R
- R Programming for Data Science
- Data Visualization with R
- Financial Time Series Analysis with R
- Quantitative Trading Strategies with R
- Derivatives with R
- Credit Risk Modelling With R
- Python for Data Science
- Machine Learning in Finance using Python
Each book includes PDFs, explanations, instructions, data files, and R code for all examples.
Get the Bundle for $29 (Regular $57)Free Guides - Getting Started with R and Python
Enter your name and email address below and we will email you the guides for R programming and Python.