• Skip to primary navigation
  • Skip to main content
  • Skip to primary sidebar
  • Skip to footer
Finance Train

Finance Train

High Quality tutorials for finance, risk, data science

  • Home
  • Data Science
  • CFA® Exam
  • PRM Exam
  • Tutorials
  • Careers
  • Products
  • Login

Price Elasticity of Demand

CFA® Exam Level 1, Economics

Demand and Supply Price Elasticity of Demand

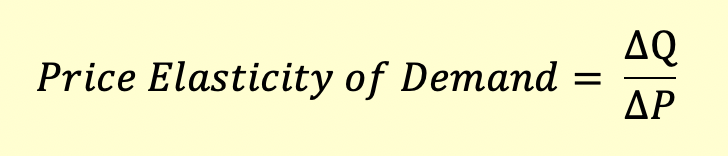
Price elasticity of demand is the most common form of elasticity. It measures the change in quantity demanded caused by a change in the price of the good. It’s calculated as a ratio of change in quantity demanded to change in price.

  • It measures the movement along the demand curve.
  • It’s always negative and but expressed as an absolute value.
  • Demand is said to be elastic when quantity demanded changes in response to change in price. If the quantity demanded is not very responsive to price change, it is said to be inelastic.
  • A value greater than 1 indicates elasticity. % change in quantity demanded is greater than % change in price. A value between 0 and 1 indicates inelasticity. % change in quantity demanded is less than % change in price.

The following two graphs depict perfectly elastic and perfectly inelastic demand.

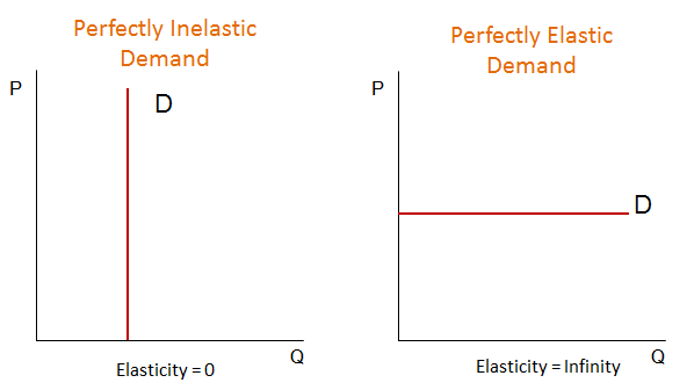
A perfectly inelastic demand means that the demand for the good remains the same irrespective of a change in price. This means that the consumers have no alternative to purchasing the good. An example is a lifesaving drug for which people will be willing to pay any price. A change in price wouldn’t cause a change in quantity demanded.

When price elasticity is -1 it’s called unitary elasticity. This is the price/quantity combination that maximizes the total revenue (price * quantity).

Previous Lesson
Back to Course
Next Lesson

Primary Sidebar

In this Course

Course Home
Types of Markets in Economics
Demand Function and Demand Curve
Supply Function and Supply Curve
Shifts in Demand and Supply Curves
Aggregating Demand and Supply Curves and Concept of Equilibrium
Excess Demand and Excess Supply
Stable and Unstable Equilibrium
Types of Auctions
Four Methods of Distributing Government Securities
Consumer and Producer Surplus
Effects of Government Regulation on Demand and Supply
Price Elasticity of Demand
Income Elasticity of Demand
Cross Price Elasticity of Demand
Return to Demand and Supply

Latest Tutorials

    • Data Visualization with R
    • Derivatives with R
    • Machine Learning in Finance Using Python
    • Credit Risk Modelling in R
    • Quantitative Trading Strategies in R
    • Financial Time Series Analysis in R
    • VaR Mapping
    • Option Valuation
    • Financial Reporting Standards
    • Fraud
Facebook Group

Membership

Unlock full access to Finance Train and see the entire library of member-only content and resources.

Subscribe

Footer

Recent Posts

  • How to Improve your Financial Health
  • CFA® Exam Overview and Guidelines (Updated for 2021)
  • Changing Themes (Look and Feel) in ggplot2 in R
  • Coordinates in ggplot2 in R
  • Facets for ggplot2 Charts in R (Faceting Layer)

Products

  • Level I Authority for CFA® Exam
  • CFA Level I Practice Questions
  • CFA Level I Mock Exam
  • Level II Question Bank for CFA® Exam
  • PRM Exam 1 Practice Question Bank
  • All Products

Quick Links

  • Privacy Policy
  • Contact Us

CFA Institute does not endorse, promote or warrant the accuracy or quality of Finance Train. CFA® and Chartered Financial Analyst® are registered trademarks owned by CFA Institute.

Copyright © 2021 Finance Train. All rights reserved.

  • About Us
  • Privacy Policy
  • Contact Us