• Skip to primary navigation
  • Skip to main content
  • Skip to primary sidebar
  • Skip to footer
Finance Train

Finance Train

High Quality tutorials for finance, risk, data science

  • Home
  • Data Science
  • CFA® Exam
  • PRM Exam
  • Tutorials
  • Careers
  • Products
  • Login

Independent and Identically Distributed Variables

FRM Part 1, Statistics

This lesson is part 6 of 7 in the course Distributions - FRM

Definition

I.I.D’s or independent and identically distributed variables are commonly used in probability theory and statistics and typically refer to the sequence of random variables. If the sequence of random variables has similar probability distributions but they are independent of each other then the variables are called independent and identically distributed variables.

This is a pre-reqeusitie for many key theorems like the Central Limit theorem which form the basis of concepts like the normal distribution and many other statistical theories. It must be noted that this assumption does not always hold true in the real world i.e. in practice. This is however the default model for random variables.

Characteristics

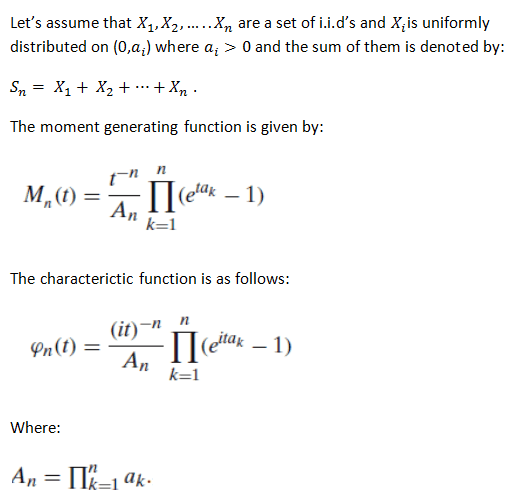
Sum of I.I.D’s

The sum of independent and identically distributed functions has a moment generating function and it has a continuous probability density function.
iid1

It can be shown that the characteristic function is absolutely integrable and the i.i.d follows a continuous and bounded uniform continuous density function given by:

 iid2

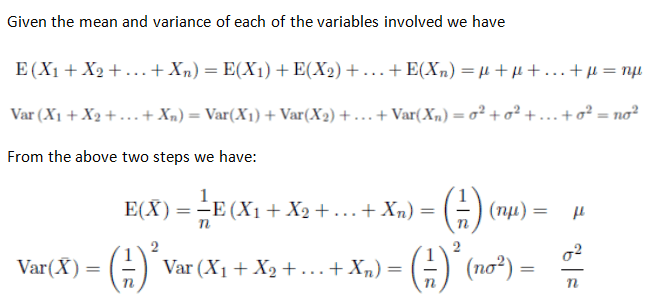
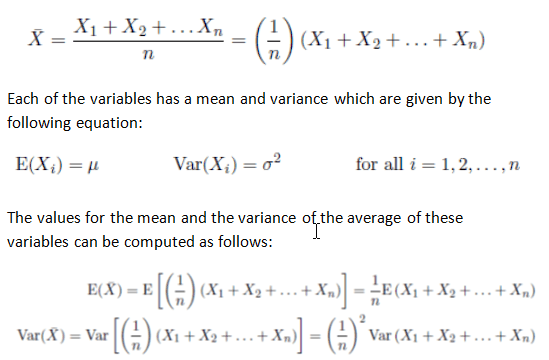
Expected Value and Variance of average of I.I.D’s

As above let’s assume that there are n independent and identically distributed random variables and we take the average of them.

The resulting variable is given by the following equation:
iid3

iid4

Financial Volatility

Financial series data are adequately expressed by Gaussian distributions. In order to calculate the volatility of a series of financial data like the Brazilian real / US$ exchange rates they are expressed as a series of reduced independent and identically distributed variables which form a best fit for the real world data.

Exponential law when applied to this set of reduced variables helps explain their volatilities. It is to be noted that this is based on the assumption that the stochastic process always exhibits a characteristic period.

Applications

Some of the most common uses of I.I.D’s are illustrated in their use in the following situations:

  • A series of consequent fair or unfair tosses of a coin
  • A series of consequent fair or unfair rolls of dice
  • A series of results of fair or unfair roulette wheel spins

Some of the other most common applications are in signal or image processing and in testing the hyotheses of the means of random variables which assumes the central limit theorem.

Previous Lesson

‹ Properties of Log-Normal Distribution

Next Lesson

Linear Combinations of Random Variables ›

Join Our Facebook Group - Finance, Risk and Data Science

Posts You May Like

How to Improve your Financial Health

CFA® Exam Overview and Guidelines (Updated for 2021)

Changing Themes (Look and Feel) in ggplot2 in R

Coordinates in ggplot2 in R

Facets for ggplot2 Charts in R (Faceting Layer)

Reader Interactions

Leave a Reply Cancel reply

Your email address will not be published. Required fields are marked *

This site uses Akismet to reduce spam. Learn how your comment data is processed.

Primary Sidebar

In this Course

  • Properties of Uniform Distribution
  • Properties of Bernoulli Distribution
  • Properties of Normal Distribution
  • Paramteric vs Non-Parametric Distributions
  • Properties of Log-Normal Distribution
  • Independent and Identically Distributed Variables
  • Linear Combinations of Random Variables

Latest Tutorials

    • Data Visualization with R
    • Derivatives with R
    • Machine Learning in Finance Using Python
    • Credit Risk Modelling in R
    • Quantitative Trading Strategies in R
    • Financial Time Series Analysis in R
    • VaR Mapping
    • Option Valuation
    • Financial Reporting Standards
    • Fraud
Facebook Group

Membership

Unlock full access to Finance Train and see the entire library of member-only content and resources.

Subscribe

Footer

Recent Posts

  • How to Improve your Financial Health
  • CFA® Exam Overview and Guidelines (Updated for 2021)
  • Changing Themes (Look and Feel) in ggplot2 in R
  • Coordinates in ggplot2 in R
  • Facets for ggplot2 Charts in R (Faceting Layer)

Products

  • Level I Authority for CFA® Exam
  • CFA Level I Practice Questions
  • CFA Level I Mock Exam
  • Level II Question Bank for CFA® Exam
  • PRM Exam 1 Practice Question Bank
  • All Products

Quick Links

  • Privacy Policy
  • Contact Us

CFA Institute does not endorse, promote or warrant the accuracy or quality of Finance Train. CFA® and Chartered Financial Analyst® are registered trademarks owned by CFA Institute.

Copyright © 2021 Finance Train. All rights reserved.

  • About Us
  • Privacy Policy
  • Contact Us