Handling Missing Values in Time Series
In the examples we saw earlier, we had good quality data with all values available for all time indexes. However, in real life, the data may contain missing values which will influence our analysis. Depending on the nature of data, we may choose to ignore missing values. However, in some cases it might be more suitable to estimate and fill the missing values. Data scientists use various techniques to estimate missing values. One common technique is to take the mean of the time series and replace NA with the mean value. Depending on the data this may or may not be suitable. For example, if the data is about loan borrowers and there are missing values in the loan interest rate, then the data scientist may decide to use the average interest rates for missing values, or if he clearly sees a pattern such as the interest rates being higher for self-employed individuals compared to salaries individuals, then the data scientist may decide to fill the missing values with means based on the categories based on their employment status.
Handling Missing Values in R
We will use our GDP data example to understand how we can estimate and fill missing values in R. Since we don't have access to a real dataset with missing values, we will make one. We will create a copy of our GDP_data dataset and then deliberately turn some values to NA. This is done by the following code:
1> GDP_mod <-GDP_data
2> GDP_mod[7] <- NA
3> GDP_mod
4        Qtr1    Qtr2    Qtr3    Qtr4
52014 17025.2 17285.6 17569.4 17692.2
62015 17783.6 17998.3      NA 18222.8
72016 18281.6 18450.1 18675.3 18869.4
8>
9
As you can see, we have made the GDP value for 2015 Q3 blank.
Plotting the Time Series
We can plot the new time series using the plot.ts() function.
1> plot.ts(GDP_mod)
2>
3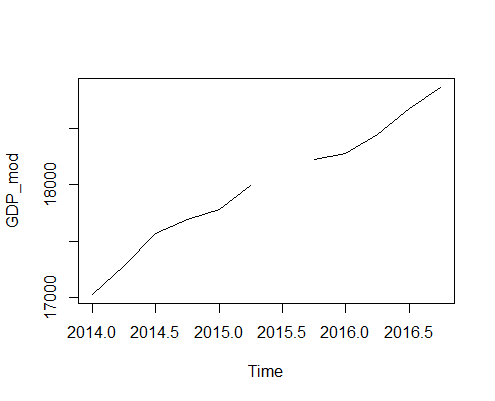
As you can see the value of 2015 Q3 is missing.
Calculate GDP Mean
We will fill the missing value with the average of GDP over the three years. In R, we can calculate the mean using the mean() function. However, in this case, the mean() function will fail because of the presence of missing values. We can remove the missing values using the parameter na.rm=TRUE to calculate the mean by removing all missing values.
1> #Calculating mean() will fail and return NA
2> mean(GDP_mod)
3[1] NA
4> #Calculate mean by removing all missing values
5> mean(GDP_mod,na.rm=TRUE)
6[1] 17986.68
7>
8
Replace NA's with Mean
Now that we have the mean of the series, we can replace the missing values with the mean value as shown below:
1> #Replace missing values with mean
2> GDP_mod[7] <- mean(GDP_mod, na.rm = TRUE)
3> print the series and notice that the missing value is now filled.
4> print(GDP_mod)
5         Qtr1     Qtr2     Qtr3     Qtr4
62014 17025.20 17285.60 17569.40 17692.20
72015 17783.60 17998.30 17986.68 18222.80
82016 18281.60 18450.10 18675.30 18869.40
9>
10
Plot Both Original and the Modified Series
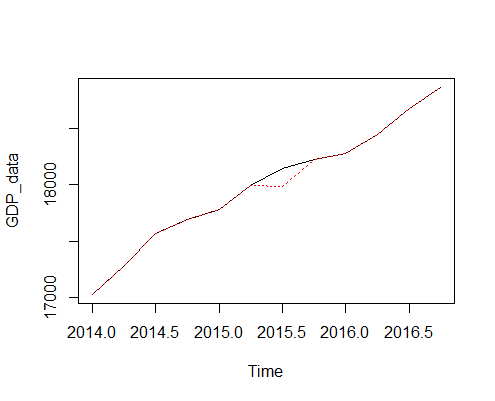
We will now plot both the original GDP_data and the modified GDP_mod time series to see how well the mean estimates the original value.
1> plot(GDP_data)
2> points(GDP_mod, type = "l", col = 2, lty = 3)
3>
4
In the below chart, the black line represents the original data and the red dotted line represents the modified data. As we can see, the mean is not really a good indicator of the actual GDP in that quarter.