Creating a Time Series Object in R
In R, we can use the ts() function to create a time series object.
Usage
Below is a simplified format of the ts function. For complete details use ?ts in your R console.
1ts(data = NA, start = 1, end = numeric(), frequency = 1,  deltat = 1, names = )
2- data: a vector or matrix of the observed time-series values.
- start: the time of the first observation.
- end: the time of the last observation, specified in the same way as start.
- frequency: the number of observations per unit of time.
- deltat: the fraction of the sampling period between successive observations; e.g., 1/12 for monthly data. Only one of frequency or deltat should be provided.
- names: a character vector of names for the series in a multiple series: defaults to the colnames of data, or Series 1, Series 2, ....
While you can have data containing dates and corresponding values in an R object of any other class such as a dataframe, creating objects of ts class offers many benefits such as the time index information. Also, when you plot a ts object, it automatically creates a plot over time.
Let's look at how we can create a time series object using the ts class.
Dataset
For this example, we will use a dataset that consists of monthly prices of the S&P Composite Index for the last three years starting from July 2014 to June 2017. We load the original data in a data vector called sp_vector.
1sp_vector <- c(1973.1,1961.53,1993.23,1937.27,2044.57,2054.27,2028.18,2082.2,2079.99,2094.86,2111.94,2099.29,2094.14,2039.87,1944.41,2024.81,2080.62,2054.08,1918.6,1904.42,2021.95,2075.54,2065.55,2083.89,2148.9,2170.95,2157.69,2143.02,2164.99,2246.63,2275.12,2329.91,2366.82,2359.31,2395.35,2433.99)
2
Print and Plot the Vector
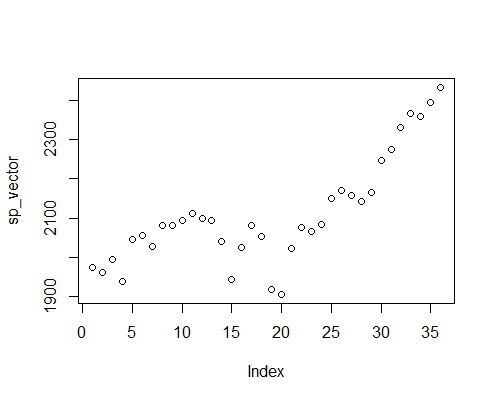
We can first try to directly print and plot the vector to observe the dataset.
1> print(sp_vector)
2 [1] 1973.10 1961.53 1993.23 1937.27 2044.57 2054.27 2028.18 2082.20 2079.99 2094.86 2111.94
3[12] 2099.29 2094.14 2039.87 1944.41 2024.81 2080.62 2054.08 1918.60 1904.42 2021.95 2075.54
4[23] 2065.55 2083.89 2148.90 2170.95 2157.69 2143.02 2164.99 2246.63 2275.12 2329.91 2366.82
5[34] 2359.31 2395.35 2433.99
6>
71> plot(sp_vector)
2>
3As you can see, the plot does not contain any time index information.
Creating Time Series Object
We can use the ts() function to convert this vector into a time series object. Our data set contains monthly stock prices from July 2017 to June 2017. There are 12 observations per year starting from July 2014. So, we will set the frequency to 12 and the set start argument to c(2014,7) where the first value is the year and the second value is the month index (July).
1> sp_ts <- ts(sp_vector,start=c(2014,7),frequency=12)
2
We can print to check that we have the correct time series.
1> print(sp_ts)
2 Jan Feb Mar Apr May Jun Jul Aug Sep Oct Nov Dec
32014 1973.10 1961.53 1993.23 1937.27 2044.57 2054.27
42015 2028.18 2082.20 2079.99 2094.86 2111.94 2099.29 2094.14 2039.87 1944.41 2024.81 2080.62 2054.08
52016 1918.60 1904.42 2021.95 2075.54 2065.55 2083.89 2148.90 2170.95 2157.69 2143.02 2164.99 2246.63
62017 2275.12 2329.91 2366.82 2359.31 2395.35 2433.99
7>
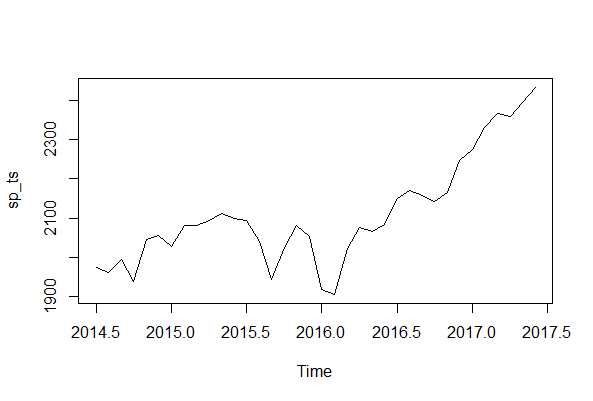
8Plot the Time Series
We can now use the plot.ts() function to plot the time series.
> plot.ts(sp_ts)
Note that it automatically recognized that it is a time series and plots time on the x-axis.