How to Perform Correlation Analysis in R for Financial Data

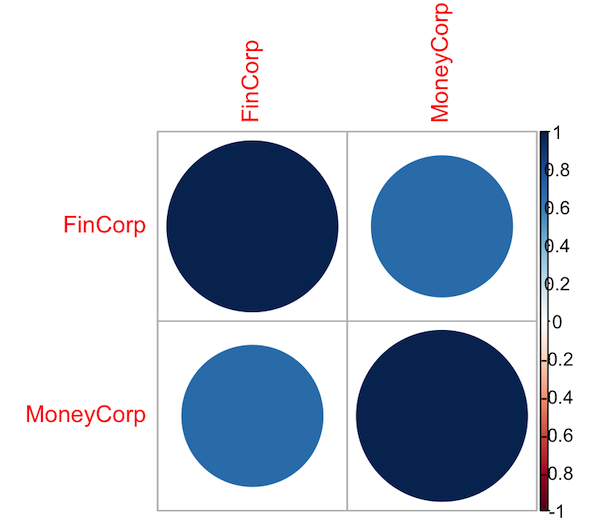
In this article, we will learn how to perform correlation analysis on financial data using R programming. R is an excellent programming language for performing data analysis. It can handle a variety of financial data, you can create visualizations, and the analysis that you do in R is reproducible which is important for financial analysis.

We will take randomly generated sample data for two fictitious companies and use that to demonstrate how to conduct a correlation analysis in R.

Ensure that you have R and RStudio installed on your system.

Install Necessary Packages

For this tutorial, we will use a package named ‘corrplot’ to visualize the correlation that we will calculate.

# Installing the packages
install.packages("corrplot")
# Loading the packages
library(corrplot)

Generate and Prepare the Data

We'll create some random financial data for two fictitious companies, "FinCorp" and "MoneyCorp".

To do so, we will use the rnorm function in R. The rnorm function in R is used to generate random numbers that follow a normal distribution, which is also known as a bell curve or a Gaussian distribution. In simple terms, rnorm(100, mean=0, sd=1) will generate 100 random numbers that are spread around 0 (the mean), with most of the numbers falling within the range of -1 to 1 (one standard deviation).

# Set the seed to make the random numbers predictable
set.seed(123)

# Generate random financial data for FinCorp
FinCorp <- rnorm(365, mean=100, sd=20)

# Generate random financial data for MoneyCorp
MoneyCorp <- FinCorp + rnorm(365, mean=0, sd=20)

# Combine the data into one dataset
data <- data.frame(FinCorp, MoneyCorp)

Once we have the data for the two companies, we combine it into a single dataset using data.frame() function.

Perform Correlation Analysis

Now that we have the data, we can perform correlation analysis. To calculate correlation between two companies we will use the cor function. This will give us the correlation matrix.

# Calculate correlation
correlationMatrix <- cor(data)

# Print the correlation matrix
print(correlationMatrix)

            FinCorp MoneyCorp
FinCorp   1.0000000 0.6805408
MoneyCorp 0.6805408 1.0000000

Visualize Correlation

We can visualize the correlation using the 'corrplot' package.

# Plotting correlation matrix
corrplot(correlationMatrix, method = "circle")

Interpret Results

The correlation coefficient ranges between -1 and 1. A result close to 1 indicates a very strong positive correlation between the two variables. A result close to -1 indicates a very strong negative correlation between the two variables. In our example, the correlation between the two companies is 0.6805408, which is positive.

In conclusion, correlation can provide important insights into the relationship between different financial variables. This can be important for diversifying a portfolio and reducing risk.

Finance Train Premium
Accelerate your finance career with cutting-edge data skills.
Join Finance Train Premium for unlimited access to a growing library of ebooks, projects and code examples covering financial modeling, data analysis, data science, machine learning, algorithmic trading strategies, and more applied to real-world finance scenarios.
I WANT TO JOIN
JOIN 30,000 DATA PROFESSIONALS

Free Guides - Getting Started with R and Python

Enter your name and email address below and we will email you the guides for R programming and Python.

Saylient AI Logo

Accelerate your finance career with cutting-edge data skills.

Join Finance Train Premium for unlimited access to a growing library of ebooks, projects and code examples covering financial modeling, data analysis, data science, machine learning, algorithmic trading strategies, and more applied to real-world finance scenarios.