Characteristics of Time Series
Time series have several characteristics that make their analysis different from other types of data.
- The time series variable (for example, the stock price) may have a trend over time. This refers to the increasing or decreasing values in a given time series.
- The variable may exhibit cyclicity or seasonality. This refers to the repeating cycle over a specific period (such as week, month, etc.) in the time series. A seasonal pattern exists when a series is influenced by seasonal factors (e.g., the quarter of the year, the month, or day of the week). Seasonality is always of a fixed and known period. As an example, if you study the quarterly earnings of a company such as John Deere, it will exhibit seasonality with the earnings peaking during the harvest season.
- The data will have serial correlation between subsequent observations.
- The data will almost always have an irregular component, which is referred to as the White Noise. This is the random variation not explained by any other factor. White Noise is a stationary process with a constant mean and variance.
A cyclic pattern exists when data exhibit rises and falls that are not of fixed period. The duration of these fluctuations is usually of at least 2 years. Many people confuse cyclic behavior with seasonal behavior, but they are really quite different. If the fluctuations are not of fixed period then they are cyclic; if the period is unchanging and associated with some aspect of the calendar, then the pattern is seasonal. In general, the average length of cycles is longer than the length of a seasonal pattern, and the magnitude of cycles tends to be more variable than the magnitude of seasonal patterns.
Due to these factors, the time series data can exhibit a huge variety of patterns and it is therefore helpful to decompose the time series into its several components each representing an underlying pattern, namely, trend, cycle, seasonality, and random (stationary). Decomposing a time series into these components is an important part of time series analysis because this is the primary assumption to forecast the time series in the future. This is generally done to help understand the time series better, but it can also be used to improve forecasts.
Examples
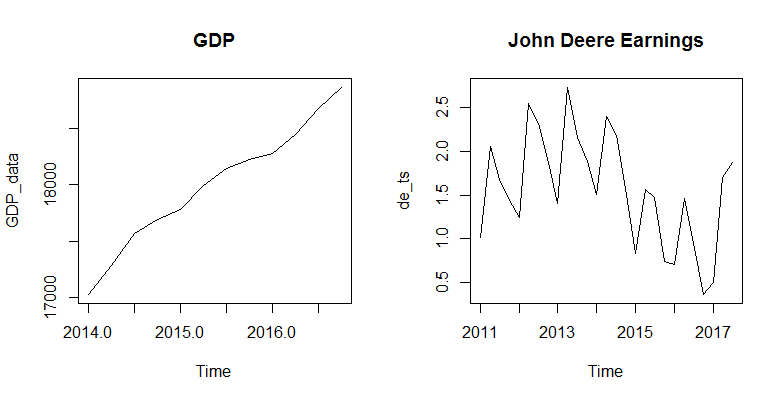
The following two charts show examples of trend and seasonality. The first chart plots the quarterly GDP data which shows a clear uptrend over time. The second chart shows the quarterly earnings for John Deere which exhibits seasonality in earnings within a year.
In the following lessons we will learn about how we can use time series analysis to develop mathematical models that provide plausible descriptions for sample data. Before we get to the models, we will learn about a few important concepts such as the stationary process, autocorrelation, and decomposition of time series in more detail.
Exercise
The following vector contains the quarterly John Deere earnings for the period Jan 2011 to July 2017.
1c(1.87,1.70,0.50,0.36,0.95,1.46,0.71,0.74,1.47,1.57,0.83,1.58,2.19,2.40,1.51,1.89,2.16,2.74,1.41,1.88,2.32,2.55,1.25,1.44,1.68,2.06,1.02)
2
The data is in reverse order, i.e., the first observation (1.87) is for July 2017, the second observation 1.70 is for Apr 2017 and so on.
- Load this vector into a variable in your R session.
- Reverse the vector using the
rev()function so that the resulting data is in increasing chronological order. - Convert this into time series data using
ts()function. - Check that the resulting data is of the class ts using the
is.ts()function. - Use the
plot.ts()function to plot the data as time series.
