Ask questions about this lesson and get instant answers.
As we learnt in part 1, the duration, as measured by the slope of the curve, changes as yields change. The slope of the curve is steeper (and the duration is larger) at low yield levels, and becomes flatter (and the duration becomes smaller) at high yield levels.
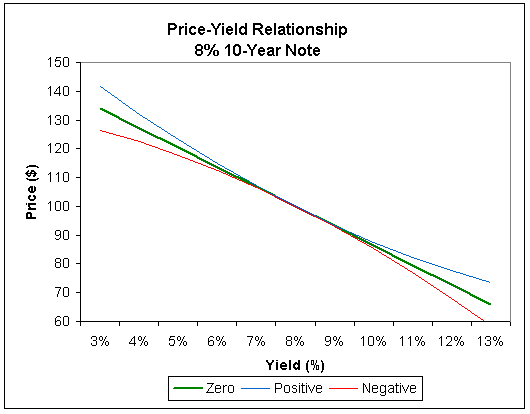
This property is called convexity. Convexity is the rate of change of duration, as yields change. Graphically, convexity measures the relative “bend” of a bond’s price-yield curve, whereas duration measures its relative “slope”. A bond is positively convex when the price increases from falling yields is greater than the price decrease caused by rising yields. Bonds without any embedded options, such as call features, will always have positive convexity. Callable bonds at par, including most mortgage-backed securities, have negative convexity. The following figure compares positive and negative convexity and the duration line (Convexity=0).
With large shifts in interest rates, bonds with positive convexity generally perform better than bonds with negative convexity. Consider a 5-year Agency, callable in 1 year and priced at par. If rates rise, the agency is priced to maturity and has approximately the same depreciation as a 5-year Treasury. If rates fall however, the security is called away and the investor realizes the appreciation of a 1-year. In other words, the callable agency priced at par has the downside risk of a 5-year with the upside potential of a 1-year. This is a perfect example of a negatively convex bond.

Although callable bonds priced at par exhibit negative convexity, deep discount or high premium callable bonds often perform similar to non-callable bonds and may have slight positive convexity. This is because, the deeper the discount of a callable bond, the less likely it will be called, and the more likely it will trade to maturity like a non-callable bond.
In estimating price changes, duration treats the price-yield function as though it were along the line tangent to the actual price-yield curve. Because duration provides a linear or first-order approximation of price changes, is often referred to as the first derivative of the price-yield function. Since the actual price-yield relationship is not linear, we can get a better price approximation if we use a higher-order derivative. Convexity represents the second derivative of the price-yield function.
By including convexity in our price change formula. We can get a better approximation of the new price as follows:
Price Change = (- Duration x Price Yield) + (0.5 x Convexity x (Yield Change)^2))
Using our previous example, if the 8% 10-year note has a 0.60 convexity, the new estimated price change is calculated as follows:
Price Change = (-6.80 x 2) + (0.5 x 0.60 x 4)
Price Change = -12.40
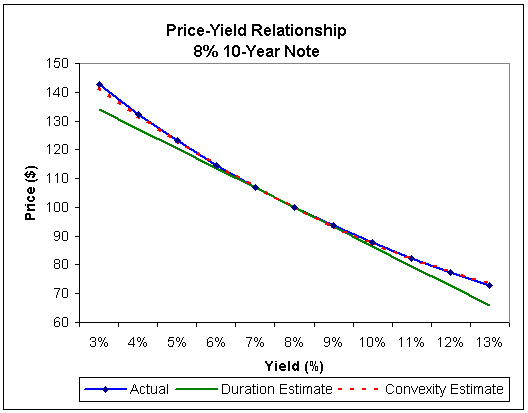
The estimated price using convexity is now 87.60 (100 – 12.40). The convexity estimate of 87.60 is much closer to the actual price of 87.54 than the duration estimate. The new estimated price-yield curve using both duration and convexity is shown below.

Notice that the convexity estimates still underestimates the price increase when yields fall, but it also underestimates the price decline when yields rise. For this reason, duration is a more conservative, although less accurate, estimation of price declines in a rising rate scenario.
Due to the increased volatility in the bond market and the heightened regulatory scrutiny, managing the interest rate risk of a bank’s investment portfolio has become a top priority. Duration has proven to be an effective tool for measuring interest rate risk and setting portfolio limits. Analysts should be aware that duration is only an estimate, and convexity can be used in conjunction with duration to arrive at a more accurate estimation of a bond’s future price.