Bond Duration and Convexity Simplified – Part 1 of 2
While analyzing bonds, it is important to apply the concepts of duration and convexity. Duration has been an excellent tool to forecast the approximate price change of a bond or portfolio of bonds. However, with larger yield changes and securities with embedded options, duration becomes less accurate at estimating price changes. Duration can be combined with convexity to arrive at a closer approximation of price for a given change in yield. This lesson discusses the relationship between duration, convexity and price-yield curve. Community bankers should be aware of this relationship, as well as how duration and convexity can be used together to estimate approximate price changes.
While analyzing bonds, it is important to apply the concepts of duration and convexity. Duration has been an excellent tool to forecast the approximate price change of a bond or portfolio of bonds. However, with larger yield changes and securities with embedded options, duration becomes less accurate at estimating price changes. Duration can be combined with convexity to arrive at a closer approximation of price for a given change in yield. This lesson discusses the relationship between duration, convexity and price-yield curve. Community bankers should be aware of this relationship, as well as how duration and convexity can be used together to estimate approximate price changes.
Duration
For both regulatory and performance reasons, bankers need a way to manage interest rate risk while realizing the current and future effects on their investment portfolio. Duration can be used to predict the market value change of a security or an entire portfolio given a rate shock on interest rates. Secondly, duration is a method for comparing the interest rate risk of securities with different coupons, maturities, cash flow and pricing characteristics. Lastly, since a specific duration value can be placed on a portfolio or each individual security, this becomes an excellent way to set interest-rate risk limits on an institution’s asset structure and capital adequacy.
Duration can be defined as the weighted average maturity of an instruments total cash flows (interest, principal and prepaid principal) in present value terms. When adjusted for yields, modified duration measures the volatility of an instrument’s market value in response to an increase or decrease in interest rates. Consider an 8% 10-year note at a price of 100 and a modified duration of 6.80. if the yield increases by 10%, duration estimates the price change as follows:
Price change = -[Duration] x [Yield Change]
Price change = -[6.80] x [2]
Price change = -13.60
The price change is negative to reflect the fact that prices decline as yields rise. The duration estimated price is 86.40 (100 – 13.60). Similarly, for a 2% decrease in yields, the estimated price is 113.60 (100 + 13.60).
The actual prices should be 87.54 and 114.88, and therefore, duration tends to underestimate the price during both rising and falling rates.
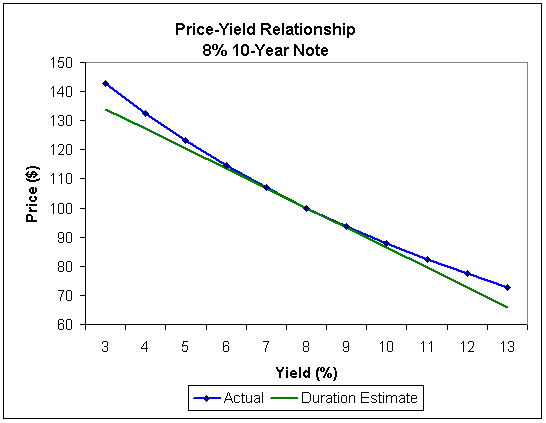
Figure 1 shows the actual price-yield relationship of the 8% 10-Year note and the straight line representing the duration estimated prices.

When examining the price-yield curve, it is important to remember three properties:
-
The duration estimated dollar prices are on the tangent line drawn from the price of 100.
-
The accuracy of the duration estimate depends on the magnitude of the yield change. For small yield changes, the tangent line is close to the curve and duration does a good job of estimating the price change. For larger changes, the divergence of the price-yield curve and the tangent line increases, and the approximation worsens.
-
Regardless of whether yields increase or decrease, the duration estimated price will always be lower than the actual new price. In other words, when yields rise, the actual drop in price is smaller than the duration estimated drop in price, and when yields fall, the actual rise in the price is larger than the duration estimated rise in price. Because of this, duration is a conservative estimate of price changes.


