• Skip to primary navigation
  • Skip to main content
  • Skip to primary sidebar
  • Skip to footer
Finance Train

Finance Train

High Quality tutorials for finance, risk, data science

  • Home
  • Data Science
  • CFA® Exam
  • PRM Exam
  • Tutorials
  • Careers
  • Products
  • Login

Automatic Identification of Model Using auto.arima() Function in R

Data Science

This lesson is part 26 of 27 in the course Financial Time Series Analysis in R

auto.arima() Function

R also has a package called forecast, which contains many forecasting functions for time series and linear models. It also contains a very useful function called auto.arima, which returns the best ARIMA model according to either AIC, AICc or BIC value. The function conducts a search over possible models within the order constraints provided.

Let’s try the auto.arima function on our time series.

> fb_fit_auto <- auto.arima(fb_ts)
> fb_fit_auto
Series: fb_ts
ARIMA(1,1,4) with drift
Coefficients:
          ar1     ma1      ma2      ma3      ma4   drift
      -0.8405  0.8626  -0.0123  -0.1632  -0.1768  0.0800
s.e.   0.1080  0.1111   0.0488   0.0509   0.0381  0.0478
sigma^2 estimated as 2.581:  log likelihood=-1426.29
AIC=2866.58   AICc=2866.73   BIC=2898.97
>

The auto.arima function suggests the best fit model as ARIMA(1,1,4) with drift.

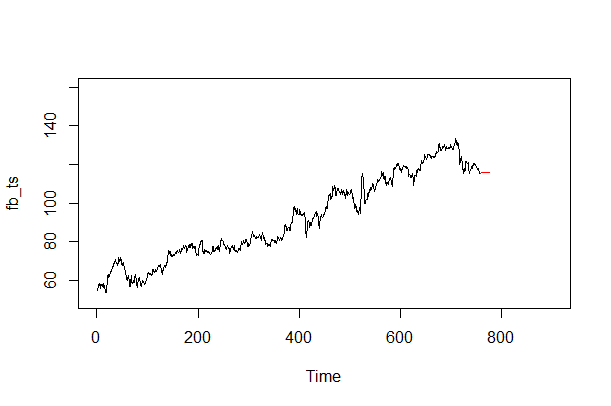
The following code creates the forecast for the FB stock prices using the suggested model:

fb_fit <- arima(fb_ts, order = c(1, 1, 4))
fb_forecast <- predict(fb_fit , n.ahead = 20)
fb_forecast_values <- fb_forecast$pred
plot.ts(fb_ts, xlim = c(0, 900), ylim = c(50,160))
points(fb_forecast_values , type = "l", col = 2)
Previous Lesson

‹ Forecasting with ARIMA Modeling in R – Case Study

Next Lesson

Financial Time Series in R – Course Conclusion ›

Join Our Facebook Group - Finance, Risk and Data Science

Posts You May Like

How to Improve your Financial Health

CFA® Exam Overview and Guidelines (Updated for 2021)

Changing Themes (Look and Feel) in ggplot2 in R

Coordinates in ggplot2 in R

Facets for ggplot2 Charts in R (Faceting Layer)

Reader Interactions

Leave a Reply Cancel reply

Your email address will not be published. Required fields are marked *

This site uses Akismet to reduce spam. Learn how your comment data is processed.

Primary Sidebar

In this Course

  • Financial Time Series Data
  • Exploring Time Series Data in R
  • Plotting Time Series in R
  • Handling Missing Values in Time Series
  • Creating a Time Series Object in R
  • Check if an object is a time series object in R
  • Plotting Financial Time Series Data (Multiple Columns) in R
  • Characteristics of Time Series
  • Stationary Process in Time Series
  • Transforming a Series to Stationary
  • Time Series Transformation in R
  • Differencing and Log Transformation
  • Autocorrelation in R
  • Time Series Models
  • ARIMA Modeling
  • Simulate White Noise (WN) in R
  • Simulate Random Walk (RW) in R
  • AutoRegressive (AR) Model in R
  • Estimating AutoRegressive (AR) Model in R
  • Forecasting with AutoRegressive (AR) Model in R
  • Moving Average (MA) Model in R
  • Estimating Moving Average (MA) Model in R
  • ARIMA Modelling in R
  • ARIMA Modelling – Identify Model for a Time Series
  • Forecasting with ARIMA Modeling in R – Case Study
  • Automatic Identification of Model Using auto.arima() Function in R
  • Financial Time Series in R – Course Conclusion

Latest Tutorials

    • Data Visualization with R
    • Derivatives with R
    • Machine Learning in Finance Using Python
    • Credit Risk Modelling in R
    • Quantitative Trading Strategies in R
    • Financial Time Series Analysis in R
    • VaR Mapping
    • Option Valuation
    • Financial Reporting Standards
    • Fraud
Facebook Group

Membership

Unlock full access to Finance Train and see the entire library of member-only content and resources.

Subscribe

Footer

Recent Posts

  • How to Improve your Financial Health
  • CFA® Exam Overview and Guidelines (Updated for 2021)
  • Changing Themes (Look and Feel) in ggplot2 in R
  • Coordinates in ggplot2 in R
  • Facets for ggplot2 Charts in R (Faceting Layer)

Products

  • Level I Authority for CFA® Exam
  • CFA Level I Practice Questions
  • CFA Level I Mock Exam
  • Level II Question Bank for CFA® Exam
  • PRM Exam 1 Practice Question Bank
  • All Products

Quick Links

  • Privacy Policy
  • Contact Us

CFA Institute does not endorse, promote or warrant the accuracy or quality of Finance Train. CFA® and Chartered Financial Analyst® are registered trademarks owned by CFA Institute.

Copyright © 2021 Finance Train. All rights reserved.

  • About Us
  • Privacy Policy
  • Contact Us