Options Strategy: Create Long Straddle with R Language
The Long Straddle is an options trading strategy that involves going long on a call option and a put option with the same underlying asset, same expiration and same strike price. This strategy tries to gain profits due to volatility in either direction as the strategy wins when the price movement is significant in any direction. In this article we will learn about how to construct a long straddle with R programming language.
The code for implementing the long straddle with R is presented below. We first create a vector of prices using the seq() function in R. For our example, we create a vector with prices ranging from 700 to 950. We chose the strike price to be 850. The call and put options have a premium of 20 and 10 respectively. We calculate the payoffs from the call and the put options and then calculate the payoff from the long straddle strategy with a long position in both call and the put option. We finally plot the strategy payoff using the ggplot library in R.
1prices <- seq(700,950,1) # Vector of prices
2strike <- 850 # strike price for both put and call
3premium_call <- 20 # option price call
4premium_put <- 10  # option price put
5
6# call option payoff at expiration
7intrinsicValuesCall <- prices - strike - premium_call
8payoffLongCall <- pmax(-premium_call,intrinsicValues)
9
10# put option payoff at expiration
11intrinsicValuesPut <- strike - prices - premium_put
12payoffLongPut <- pmax(-premium_put,intrinsicValuesPut)
13
14# The payoff of the Strategy is the sum of the call and put payoff. Need
15# to sum wise element by element between the two vectors
16payoff <- rowSums(cbind(payoffLongCall,payoffLongPut))
17
18# Make a DataFrame with all the variable to plot it with ggplot
19results <- data.frame(cbind(prices,payoffLongCall,payoffLongPut,payoff))
20
21ggplot(results, aes(x=prices)) +
22  geom_line(aes(y = payoffLongCall, color = "LongCall")) +
23  geom_line(aes(y = payoffLongPut, color="LongPut"))+
24  geom_line(aes(y=payoff, color = 'Payoff')) +
25scale_colour_manual("",
26                    breaks = c("LongCall", "LongPut", "Payoff"),
27                    values = c("darkred", "darkblue", "darkgreen")) + ylab("Payoff")+
28 ggtitle("Long Straddle Payoff")
29
The following graph shows the payoff from the long straddle strategy.
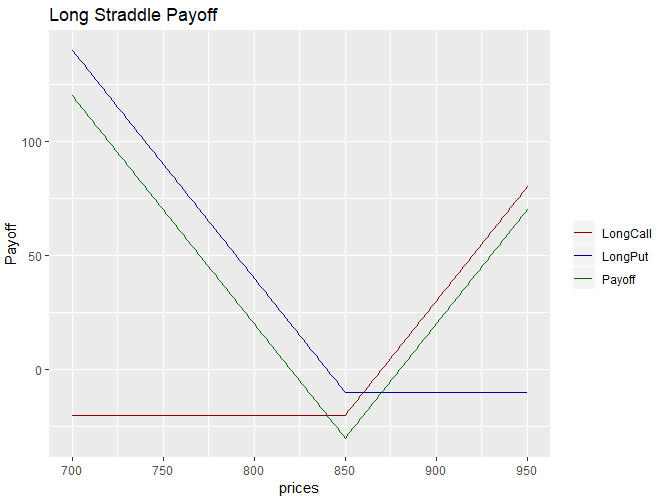
As we can observe in the graph above, the profits from the strategy (green line) are high when any of the stock price moves significantly away from the strike price at expiration. The maximum gain is unlimited in either direction. At the time of expiration, the profit will be the difference between the stock price and the strike price. If at expiration, the stock price is exactly the same as strike price, both options will not be exercised and will expire worthless. The trader’s maximum loss from the strategy will be the premium paid for the two options. The strategy is suitable under high volatility scenarios when trader expects a significant move in the stock price in either direction.
