Options Strategy: Create Bull Call Spread with R Language
Bull Call Spread is an options trading strategy that involves the purchase of two call options with the same expiration and different strike prices. In the strategy, the trader buys one call option with a lower strike price and sells another call option with a higher strike price. Both calls have the same underlying security. The strategy has a limited potential profit and loss as it has a ceiling for the profits and a floor for losses. In this article we will simulate the bull call spread with R.
The inputs and the strategy code for bull call spread with R are provided below. Note that for the purpose of the example, we are generating our own data, i.e., a sequence of numbers using the seq() function in R. We create the strategy with two call options one with a low strike price of 450 and another with a high strike price of 500. We also have the premium amounts of these two. We calculate the intrinsic value and payoff from each call option and then we calculate the strategy payoff. Then we plot the strategy payoff at different prices using the ggplot function in R.
1prices <- seq(400, 550,1) # Vector of prices
2k_low = 450  # Low Strike price for call
3k_high = 500 # High Strike Price for call
4premium_low = 10
5premium_high = 1
6# Intrinsic Value and Payoff long call
7intrinsicValueLongCall <- prices - k_low - premium_low
8payoffLongCall <- pmax(-premium_low,intrinsicValueLongCall)
9# Intrinsic Value and Payoff short call
10intrinsicValueShortCall <- prices - k_high - premium_high
11payoffShortCall <- pmin(premium_high,-intrinsicValueShortCall)
12# Strategy Payoff
13payoff <- rowSums(cbind(payoffLongCall,payoffShortCall))f
14# Generate a dataframe with the payoffLongCall, payoffShortCall and payoff vectors
15# in order to plot the strategy payoffs using ggplot
16results <- data.frame(cbind(payoffLongCall,payoffShortCall,payoff))
17ggplot(results, aes(x=prices)) +
18  geom_line(aes(y = payoffLongCall, color = "LongCall")) +
19  geom_line(aes(y = payoffShortCall, color="ShortCall"))+
20  geom_line(aes(y=payoff, color = 'Payoff')) +
21  scale_colour_manual("",
22                      breaks = c("LongCall", "ShortCall", "Payoff"),
23                      values = c("darkred", "darkblue", "darkgreen")) + ylab("Payoff")+
24  ggtitle("Bull Call Spread Payoff")
25
The following graph shows the payoff from the bull call spread.
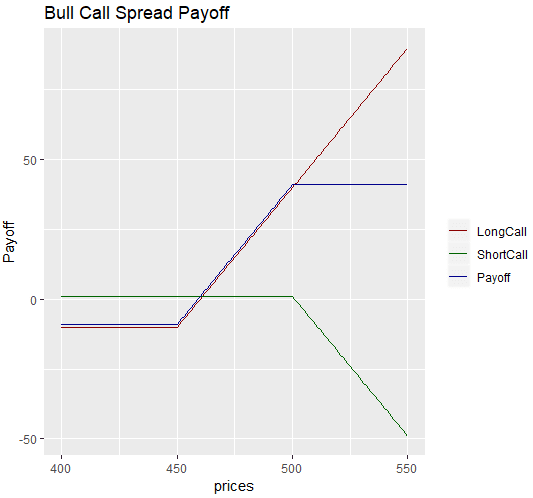
In the above graph, the blue line represents the payoff from the strategy, which is a range. For the long call, the options trader pays a premium which is the maximum loss from the long call. For the short call, the trader receives a premium. The difference between the two premiums is called the spread. The maximum profit from the strategy is limited to the differences between the strike prices minus the net spread (after adjusting commissions paid to brokers). The maximum loss from the strategy is the net spread.In the above graph, the blue line represents the payoff from the strategy, which is a range. For the long call, the options trader pays a premium which is the maximum loss from the long call. For the short call, the trader receives a premium. The difference between the two premiums is called the spread.
The maximum profit from the strategy is limited to the differences between the strike prices minus the net spread (after adjusting commissions paid to brokers). The maximum loss from the strategy is the net spread. The strategy breaks even at the strike price of the long call (the lower strike) plus the net premium paid. The strategy is best suited for bullish scenarios where the price of the underlying stock is expected to rise above the strike price of the short call option.In the above graph, the blue line represents the payoff from the strategy, which is a range. For the long call, the options trader pays a premium which is the maximum loss from the long call. For the short call, the trader receives a premium. The difference between the two premiums is called the spread. The maximum profit from the strategy is limited to the differences between the strike prices minus the net spread (after adjusting commissions paid to brokers). The maximum loss from the strategy is the net spread.
