Measures of Dispersion

Data has a pattern of distribution. It is usually not concentrated in one area but dispersed or scattered. The mean is not useful to measure this scattering. This scattering can be captured using the measures of dispersion. The mean can be seen as a fixed point from which the dispersion can be measured either in absolute terms or relative terms.

Absolute Measures of Dispersion

When the measures of dispersion are measured in the same units that the data is measured, we call it absolute dispersion. We do so using the range, mean absolute deviation, and standard deviation.

Range

The range is the difference between the largest and smallest unit in the distribution. If R is the range, L is the largest variable, and S the smallest, then R= L - S. The range can be calculated for closed frequency distributions where the limits are clearly defined. The range can be calculated for grouped and ungrouped data.

Ungrouped data

6,18, 54, 76, 86, 21

R = L - S

Therefore R = 86 -6, i.e 80.

Grouped data

Kms walked per monthNumber of people
10 to 2515
25 to 4010
40 to 553
55 to 701

Upper limit is 70 and the lower limit is 10. The range is therefore 70-10 or 60.

Mean Absolute Deviation

The mean absolute deviation is the average of the absolute values of the difference between each observation and the arithmetic mean.

First, the arithmetic mean for the dataset is calculated. Then the difference between each data set value and the mean is calculated in absolute terms. Then the arithmetic mean for these deviations is calculated.

Mean deviation formula:

Learn more about Range and Standard Absolute Deviation.

Standard Deviation

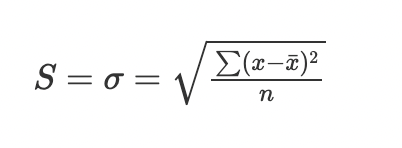
Standard deviation is the dispersion of the variable in the data set from the arithmetic mean of the data set. It is calculated as a square root of the average variability of the dataset. Variance is defined as the squared difference from the mean.

To calculate variance we first calculate the mean for the dataset. Then we subtract the data set values from the mean and square the difference. Then we calculate the average of these squared differences. This is the variance.

Standard deviation is the square root of the variance. Learn more about variance and standard deviation.

Why do we take the squared differences? If we take the mean of the absolute mean deviations it may not capture the variances especially if the data set is highly skewed. In order to avoid this, we square each difference and take the square root of the squared variances average.

The standard deviation can be calculated for the population or a sample.

Here are the formulas:

Standard deviation for population:

σ = Standard deviation

xi = Observation

x̄ = Mean

n = Total number of onsevations

Standard deviation for sample:

σ = Standard Deviation

xi = Observations

x̄ = Mean

n = Total number of observations

The main difference is that when we are working with samples, we divide by n-1 instead of n when calculating the standard deviation. The output is extrapolated for the population to make general conclusions about it.

Relative Measures of Dispersion

Relative measures of dispersion, as the name suggests, compare two or more data sets and are expressed in terms of ratio and percentages. The comparisons can be done even if the data sets have different units of measurement.

Some of the relative measures of dispersion are coefficient of range, coefficient of variation, and coefficient of mean deviation.

Coefficient of Range

Coefficient of range is the ratio of the difference of the largest and smallest values in the range, divided by the sum of the largest and smallest values in the range. If L is the largest value in the range, and S is the smallest value in the range then Coefficient of Range, COR, is:

COR = L-S/ L+S

It tells us about the spread of the data. A high coefficient of range indicates large spread between the data and a low COR is indicative of low variance or clustering of data.

Coefficient of Variation

Coefficient of variation or COV is a percentage. It is calculated by dividing the standard deviation by the mean. It is a unitless value and is a useful measure to measure two disparate data sets. A high coefficient of variation indicates a higher level of dispersion around the mean. The formula for Coefficient of Variation or COV is:

Coefficient of Variation = Standard Deviation / Mean

Learn more about coefficient of variation.

Coefficient of Mean Deviation

Coefficient of Mean Deviation is arrived at by dividing the mean absolute deviation by the mean. Greater the coefficient of mean deviation, greater is the spread of data. Lower the coefficient, lesser the spread of data.

Coefficient of Mean Deviation = Mean Absolute Deviation / Mean

The measures of dispersion are useful in understanding the data beyond the central tendency, i.e, spread of the data. Relative measures of dispersion help compare two different sets of data, and it helps go into variability in the data set even when two datasets have the same mean. In using absolute and relative measures of dispersion we get a better idea about the data under analysis.

Finance Train Premium
Accelerate your finance career with cutting-edge data skills.
Join Finance Train Premium for unlimited access to a growing library of ebooks, projects and code examples covering financial modeling, data analysis, data science, machine learning, algorithmic trading strategies, and more applied to real-world finance scenarios.
I WANT TO JOIN
JOIN 30,000 DATA PROFESSIONALS

Free Guides - Getting Started with R and Python

Enter your name and email address below and we will email you the guides for R programming and Python.

Saylient AI Logo

Accelerate your finance career with cutting-edge data skills.

Join Finance Train Premium for unlimited access to a growing library of ebooks, projects and code examples covering financial modeling, data analysis, data science, machine learning, algorithmic trading strategies, and more applied to real-world finance scenarios.