Data Science, Machine Learning & AI
Welcome to your Data Science & AI learning hub. Browse by section below, or start with Getting Started if you're just beginning.
R Programming
R for statistical computing: data manipulation with tidyverse, visualization with ggplot2, and time series analysis.
Courses

Premium17 lessons
R Programming for Data Science
Data manipulation with dplyr, tidyr, and the tidyverse

Premium29 lessons
Data Visualization with R
Learn how to create beautiful data visualizations in R using Base R graphics and ggplot2
Premium27 lessons
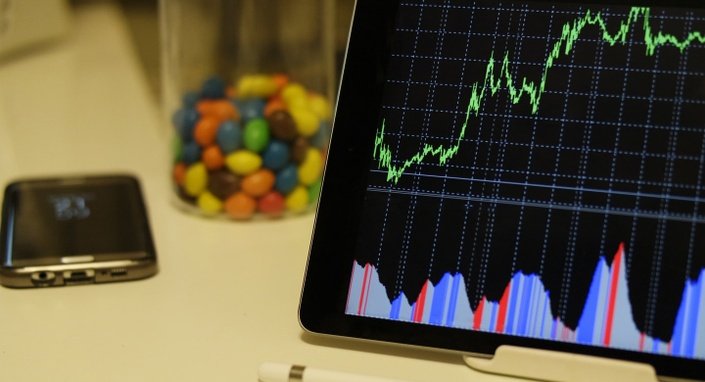
Financial Time Series Analysis in R
Time series analysis, forecasting, and financial modeling