Facets for ggplot2 Charts in R (Faceting Layer)
Faceting is a very useful visualization technique that allows you to create multiple versions of the same plot with multiple subsets of the data. This is also called small multiples. ggplot2 allows us to small multiples in two ways: facet_wrap() and facet_grid(). The default is facet_null() which produces a single plot.
We will use German Credit dataset to demonstrate faceting with both these functions.
facet_wrap()
facet_wrap() creates a plot for every level of a factor passed to it. For example, if we create a scatter plot with Credit Amount on x-axis, Duration of Credit on y-axis, and pass the factor 'Type of Housing' as facet. Then it will create the number of plots equal to the levels in type of Housing with each plot displaying the points only for that level.
1g <- ggplot(df,aes(x=Duration.of.Credit..in.months.,y=Credit.amount))
2g+geom_point()+geom_smooth()+
3  facet_wrap(~Type.of.housing)
4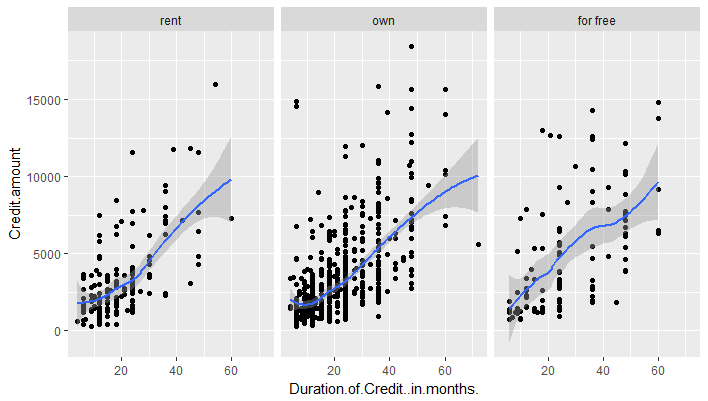
You can control how the panels are wrapped into a grid with ncol, nrow, as.table and dir. ncol and nrow control how many columns and rows (you only need to set one). as.table controls whether the facets are laid out like a table (TRUE), with highest values at the bottom-right, or a plot (FALSE), with the highest values at the top-right. dir controls the direction of wrap: horizontal or vertical.
In the following example, we pass the factor 'Job' for faceting (which as 4 levels). We pass the parameter nrow = 2 to wrap the plots in 2 rows.
1g <- ggplot(df,aes(x=Duration.of.Credit..in.months.,y=Credit.amount))
2g+geom_point()+geom_smooth()+
3  facet_wrap(~Job, nrow = 2)
4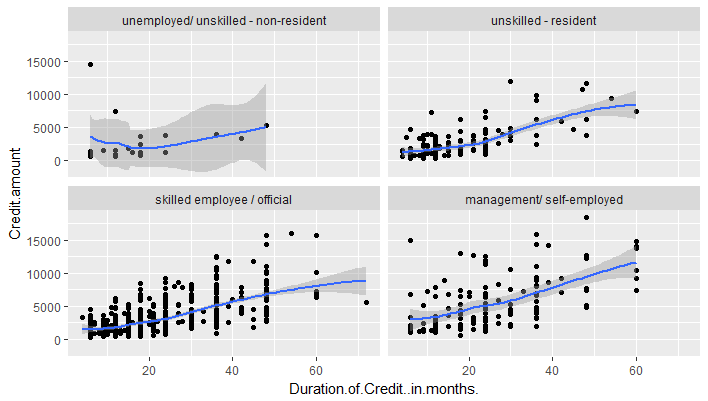
There are two important observations here. One, facets create subsets of the same dataset. Two, the x and y scales of each plot are the same in each facet.
facet_grid()
facet_grid() allows use to facet using two variables.
. ~ a spreads the values of a across the columns as shown below:
1g <- ggplot(df,aes(x=Duration.of.Credit..in.months.,y=Credit.amount))
2g+geom_point()+geom_smooth()+
3  facet_grid(. ~ Loan.Quality)
4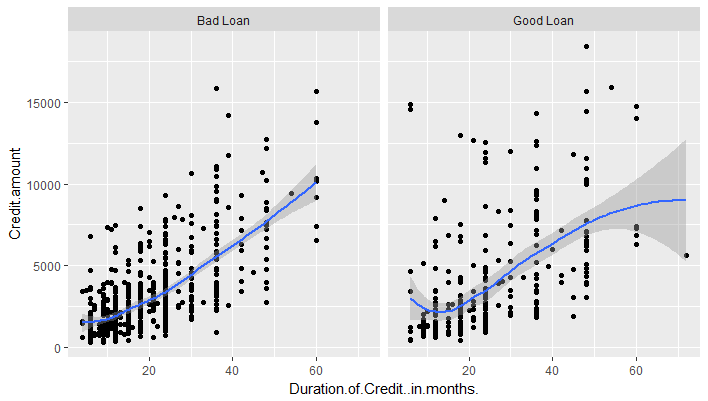
b ~ . spreads the values of b down the rows.
1g <- ggplot(df,aes(x=Duration.of.Credit..in.months.,y=Credit.amount))
2g+geom_point()+geom_smooth()+
3  facet_grid(Loan.Quality ~ .)
4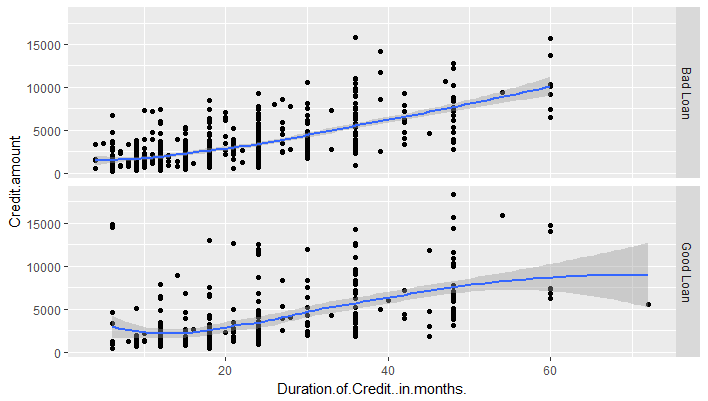
a ~ b spreads a across columns and b down rows.
It is recommended to put the variable with the greatest number of levels in the columns, to take advantage of the aspect ratio of your screen.
1g <- ggplot(df,aes(x=Duration.of.Credit..in.months.,y=Credit.amount))
2g+geom_point()+geom_smooth()+
3  facet_grid(Type.of.housing ~ Loan.Quality)
4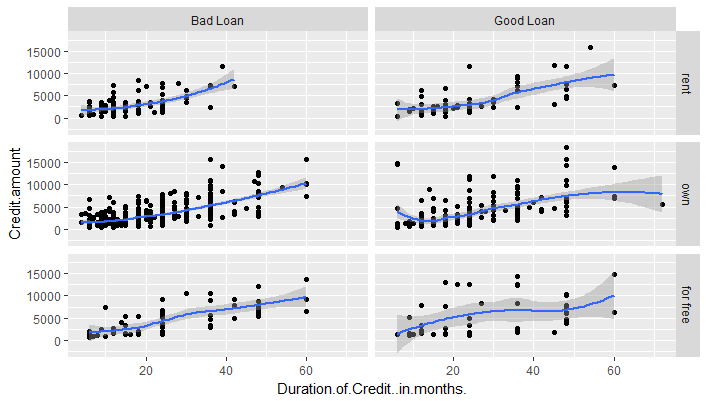
Facet Scales
For both the facet functions, you can control whether you want the x and y position scales for each panel to be fixed across all panels (fixed) or allow to vary between panels (free).
scales = "fixed": x and y scales are fixed across all panels.scales = "free_x": the x scale is free, and the y scale is fixed.scales = "free_y": the y scale is free, and the x scale is fixed.scales = "free": x and y scales vary across panels.
Usually you will want all facets to have same x and y scales for the purpose of comparability. However, in some cases free scales will make more sense, for example, in a situation where each level is measured on a different scale.
