Exploring Open Interest for Futures Contracts with R
In this article we will explore in greater depth the Open Interest variable of the futures contracts price data and see in which months of the year this variable tends to increase for a particular contract. For this purpose, we have gathered contracts futures data from CSI 500 Shanghai Index.
Our task will be to load all CSV files from a specific folder in R environment, read each file as a data frame and returns a list structure where each item is the contract code and the values of the list are the Open Interest values on each trading day. We will call this function openInterest and the directory parameter is the folder that stores all the csv files with the individual contract information.
With this structure we can obtain the min, max and mean Open Interest by contract for a specific year.
Download the below data and store all the csv files in one folder in your computer.
1openInterest <- function(directory){
2  data <- c(list.files(directory))
3  files <- paste(directory,data,sep="/")
4  contractsNumber <- length(files)
5    OI <- list()
6  # Loop over all contracts in the directory folder
7  for (contract in 1:contractsNumber){
8    openInterest <- c()
9    contractData <- read.csv(files[contract])
10    # Retrieve the open Interest column that is in the 9 position
11    openInterest <- contractData[,9]
12    OI[[contract]] <- openInterest
13      }
14  names(OI) <- gsub('.csv','',list.files(directory))
15  return(OI)
16}
17
18OI <- openInterest("C:/Users/Nicolas/Documents/Shanghai CSI")
19
20# The contracts have different periods. Using the sapply command with the OI list
21# we can view the number of trading days for each contract.
22
23contracts_Length <- sapply(OI,length)
24
25# contracts_Length has the following values:
26
1# Remove the first Open Interest value in all contracts which is zero. We want to #know the min value of Open Interest for each contract, but should remove 0 that is #when the contract starts. This function will keep only values from each item of the #OI list that are different from zero.
2
3newOIList <- lapply(OI, function(i) Filter(function(x) any(x != 0), i))
4
5# Calculate mean, max and min for each item of the newOIList. This would return
6# all maxs,means and mins Open Interest values for each particular contract.
7
8mean<- sapply(newOIList,mean,na.rm=TRUE)
9max <- sapply(newOIList,max,na.rm=TRUE)
10min <- sapply(newOIList,min,na.rm=TRUE)
11
12# Make a data frame with cbind command that combine the three lists by columns
13
14OI_metrics <- data.frame(cbind(max,min,mean))
15
16# Create a column with the contracts code and reset the index by assign NULL to r
17# rownames.
18
19OI_metrics$Contract <- row.names(OI_metrics)
20rownames(OI_metrics) <- NULL
21
22#OI_metrics is a dataframe with wide format with the following values:
23
24    max min means      Contract
251 20457 228 11054 CFFEX-ICF2018
262 17308 165  7451 CFFEX-ICG2018
273 23228  95  5825 CFFEX-ICH2018
284 20545  67 11786 CFFEX-ICJ2018
295 19696  81  8848 CFFEX-ICK2018
306 28363 162  7798 CFFEX-ICM2018
317 26187 232 14225 CFFEX-ICN2018
328 34943 116 11126 CFFEX-ICU2018
339 43776 131 14167 CFFEX-ICZ2018
34
35
36# Next step is to transform the data from wide to long in order to make a grouped
37# barplot and show the metrics values by contract. The OI_metrics has a wide format #now, because each contract is in a unique row. In order to make a barplot we need #to change the format to long format. The gather command from dplyr package #transform the shape of the data from wide to long.  The purpose of this is to get #tidy data for their analysis.
38
39long_OI_metrics <- gather(OI_metrics, metric, value ,c('max','min','mean'))
40
41# Use order command with Contract column to sort the dataframe by contract name
42
43OI_metricsByContracts <- long_OI_metrics[order(long_OI_metrics$Contract),]
44
45# The OI_metricsByContracts is a dataframe with long format that allow us to create a barplot by year.
46
47    Contract     metric value
481  CFFEX-ICF2018    max 20457
4910 CFFEX-ICF2018    min   228
5019 CFFEX-ICF2018  means 11054
512  CFFEX-ICG2018    max 17308
5211 CFFEX-ICG2018    min   165
5320 CFFEX-ICG2018  means  7451
543  CFFEX-ICH2018    max 23228
5512 CFFEX-ICH2018    min    95
5621 CFFEX-ICH2018  means  5825
574  CFFEX-ICJ2018    max 20545
5813 CFFEX-ICJ2018    min    67
5922 CFFEX-ICJ2018  means 11786
605  CFFEX-ICK2018    max 19696
6114 CFFEX-ICK2018    min    81
6223 CFFEX-ICK2018  means  8848
636  CFFEX-ICM2018    max 28363
6415 CFFEX-ICM2018    min   162
6524 CFFEX-ICM2018  means  7798
667  CFFEX-ICN2018    max 26187
6716 CFFEX-ICN2018    min   232
6825 CFFEX-ICN2018  means 14225
698  CFFEX-ICU2018    max 34943
7017 CFFEX-ICU2018    min   116
7126 CFFEX-ICU2018  means 11126
729  CFFEX-ICZ2018    max 43776
7318 CFFEX-ICZ2018    min   131
7427 CFFEX-ICZ2018  means 14167
75
76# Finally we will use the ggplot2 package to plot the min, max and mean values of the gold mini future contract on 2017 from Indian Exchange
77
78ggplot(OI_metricsByContract,aes(x=Contract,y=value,fill=metric)) +
79  geom_bar(stat="identity",position="dodge")+
80  xlab("Gold Mini Future Contracts 2017")+ylab("Open Interest") +
81  theme(axis.text.x = element_text(angle = 45, hjust = 1)) +ggtitle("CSI SHANGAI Futures Open Interest")
82
CSI 500 Shanghai Futures Open Interest Metrics
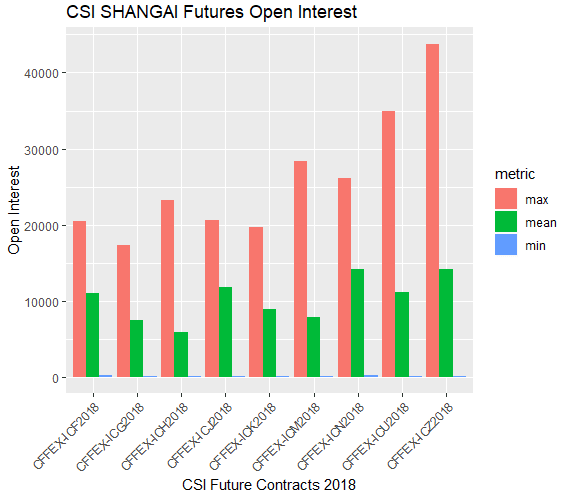
From the barplot above, we can observe that the highest Open Interest is in the CFFEX-ICZ2018 contract that is the Dec 2018 contract. Secondly, the CFFEX-ICU2018 future contract which is from Nov 2018 is the second highest traded contract in 2018. The contracts at the beginning of the year such as Jan, Feb, Mar, Apr and May have less trading activity than contracts at the end of the year.
