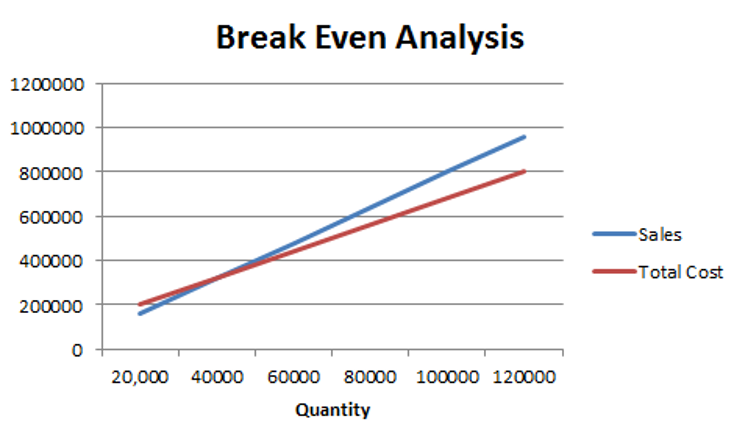
For a firm, the breakeven point is the quantity of the sales required by the firm to cover its total cost, i.e., Total revenue = Total cost. At this quantity of sales the firm's net income is zero.
We know that:
Q(P−VC)−F=EBIT
F includes both fixed operating cost and fixed financing cost.
Breakeven quantity is the quantity where EBIT = 0. So, we solve for Q where EBIT = 0.
Q=(P−VC)(Total Fixed Cost)
Example
Let's say we have the following data about a company:
Price per unit = $8
Variable costs = $6
Fixed operating costs = $20,000
Fixed financing costs = $60,000
The breakeven quantity will be calculated as follows:
Q=8−680,000=40,000 Units
The following graph summarizes the relationship between sales, costs, net income and net losses.
Break-even Analysis
We can make the following observations from the above graph:
A firm with higher operating and financial leverage will have higher breakeven quantity.
Leverage magnifies the impact of change in sales on change in net income.
We can also modify the above formula to calculate the operating breakeven quantity:
Q=(P−VC)(Fixed Operating Cost)
In the above example, the operating breakeven quantity will be:
Q=(8−6)20,000=10,000 units
Continue Reading
Free Content, Requires Login
This content is free but requires you to be logged in to access.
Create a free account to access this tutorial and all other free tutorials, courses, and resources.