Lesson Downloads
Analytical Approach to Calculating VaR (Variance-Covariance Method)
We earlier saw how VaR can be calculated using the parametric method. We will now look at this method in detail, and also understand how VaR can be easily calculated using matrices.
VaR of a Single Asset
VaR of a single asset is the value of the asset multiplied by its volatility. Here, the volatility can be calculated at the desired confidence level.
Example:
An IBM stock is trading at $115 with a 1-year standard deviation of 20%. In the normal distribution, 95% confidence level is 1.645 standard deviations away from the mean. Therefore, our VaR at 95% confidence level will be: VaR (95%) = 115* 0.20 * 1.645 = 37.835
Assumption of Normality
A distribution is described as normal if there is a high probability that any observation form the population sample will have a value that is close to the mean, and a low probability of having a value that is far from the mean. The normal distribution curve is used by many VaR models, which assume that asset returns follow a normal pattern. A VaR model uses the normal curve to estimate the losses that an institution may suffer over a given time period. Normal distribution tables show the probability of a particular observation moving a certain distance from the mean.
If we look along a normal distribution table we see that at -1.645 standard deviations, the probability is 5%; this means that there is a 5% probability that an observation will be at least 1.645 standard deviations below the mean. This level is used in many VaR models.
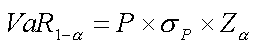
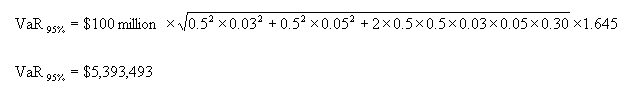
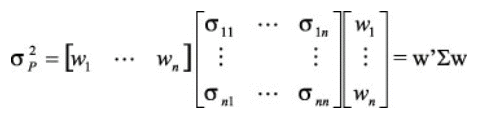
VaR of a Portfolio
Generally VaR will not be calculated for a single position, but a portfolio of positions. In such a case will require the portfolio volatility.
The portfolio volatility of a two-asset portfolio is given by:
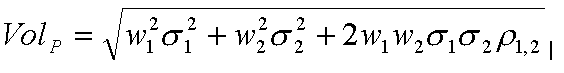
Where:
- is the weighting of the first asset
Test Your Knowledge
Check your understanding of this lesson with a short quiz.