Get full access to all Data Science, Machine Learning, and AI courses built for finance professionals.
One-time payment - Lifetime access
Or create a free account to start

A step-by-step guide covering Python, SQL, analytics, and finance applications.
Or create a free account to access more
Get full access to all Data Science, Machine Learning, and AI courses built for finance professionals.
One-time payment - Lifetime access
Or create a free account to start

A step-by-step guide covering Python, SQL, analytics, and finance applications.
Or create a free account to access more
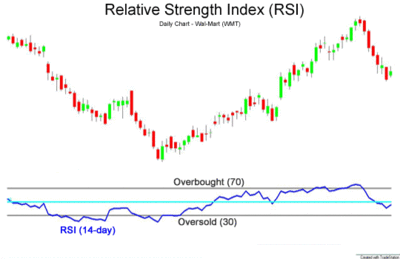
Relative Strength Index is a technical indicator used to chart the strength or weakness of a stock based on its closing prices for a specified trading period. For the given period, it compares the magnitude of gains and losses based on the principle of momentum. Momentum refers to the rate of rise or fall in prices. The RSE calculates the momentum as a ratio of higher closing prices to lower closing prices. Stocks that have more or stronger positive changes will have higher RSI.
The typical timeframe for calculating RSI is 14 days, and is measured on a scale of 0 to 100. The high and low levels are marked as 70 and 30.
Formula:
Where, RS is the relative strength, ratio of average positive closes, and average negative closes for the defined period.

When the RSI crosses 70 levels, it suggests that the stock has been overbought and is overvalued. Therefore, it is time to sell and pull back. When RSE reaches 30 and below, it suggests that the stock is oversold, and is undervalued. Therefore, it is time to buy.