Ask questions about this lesson and get instant answers.
The sensitivity analysis of fixed-income instruments refers to how the price moves in relation to each of sensitivity estimates such as price, duration and convexity. The relationships are mainly represented by the following three equations:

Equation 3 obviously implies that the effect on price is positive once convexity is positive. This normally holds true to regular coupon paying bonds but in cases where optionality is embedded convexity is negative.
For some securities like Mortgage Backed Securities for which the cash flow schedule is uncertain the above sensitivity measures cannot be computed. Pricing models that can handle these specific characteristics are then applied for these instruments.
Duration and Convexity Applied
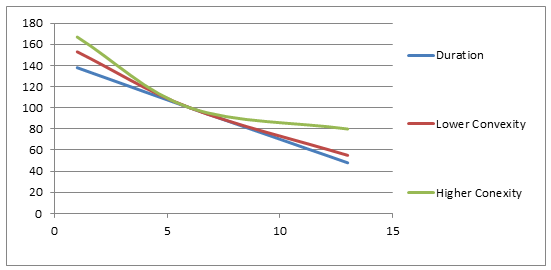
The rule-of –thumb in the market is that bonds with good convexity are always good for trading as they are attractive investment options in scenarios where yields move in any direction. From a practical stand point the dollar duration is a less indicative measure for making investment decisions and measures the negative slope of the tangent to formula 2 at the beginning of the curve.
The convexity relationships are depicted in the following graph:

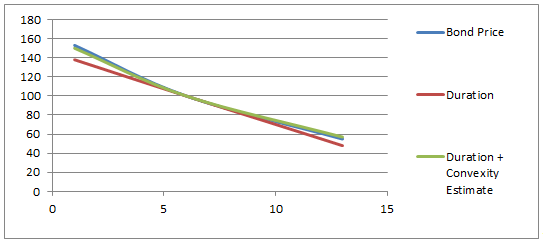
An inverse relationship between price and yield is depicted by equation 1. The effects of small movements in yield are best represented by the tangent to this curve i.e. the duration estimate is the best indicator for this. For large movements in price, equation 3 represents a best fit as the relationship becomes more curved and the duration estimate deteriorates. The second order approximation in this case holds true.
The following graph depicts these relationships:

Effective duration and convexity
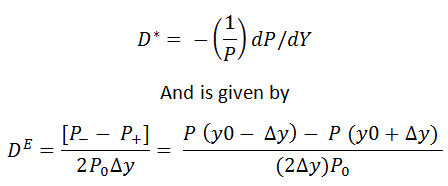
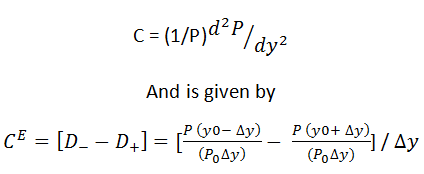
Effective duration and convexity are duration and convexity measures that capture the effects of price movements in both the up and down scenarios. The price movements are of course of the same magnitude. The effective convexity is the difference in dollar durations for a movement in both directions and is positive if the duration increases as yields fall.
The formula for effective duration is derived from the following relationship:

The effective convexity follows from the following equation:

Coupon Curve Duration
Bonds with the same maturities but different coupons would obviously yield different effective convexities for the same change in yields. This is of course due to the different coupon rates. If the effect of the difference in coupon rates is accounted instead of changing the yield using the effective duration method we get the duration due to coupon changes also termed as coupon curve duration. This approach finds application for securities that cannot be re-priced for different yield levels and the data that should be required would be the market price for securities with varying coupon characteristics.
The attached spreadsheet shows the computation for effective duration and convexity.