
Statistical Concepts and Market Returns / Practice quiz
Statistical Concepts and Market Returns
This quiz is a part of the CFA Level 1 reading 'Statistical Concepts and Market Returns'.
16 questions
- What of the following statements is the most accurate distinction between a population parameter and a sample statistic?
- A list of 5 mutual funds provided the following yearly returns: 70%, 64%, 80%, 74%, and 92%. What is the median for this list?
- An investor has a portfolio of 5 stocks. The portfolio has an arithmetic mean of 10%, and harmonic mean of 6%. What can be said about the geometric mean of the portfolio?
- Which of the following would indicate that a dataset is not bell-shaped?
- We have the following data about a portfolio:
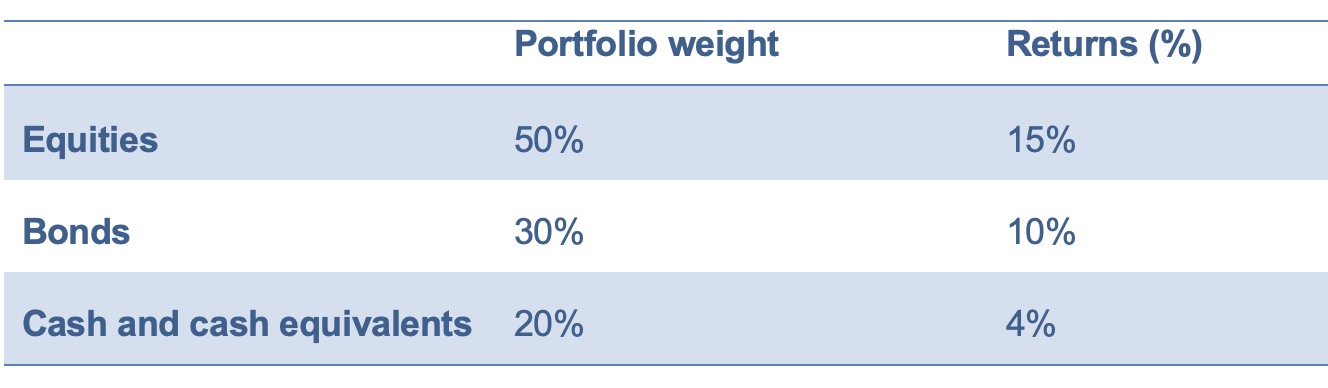
Bonds have a correlation of 40% with equities and cash has a correlation of only 5% with equities. Calculate the portfolio returns.
- We have the following information about three portfolios.
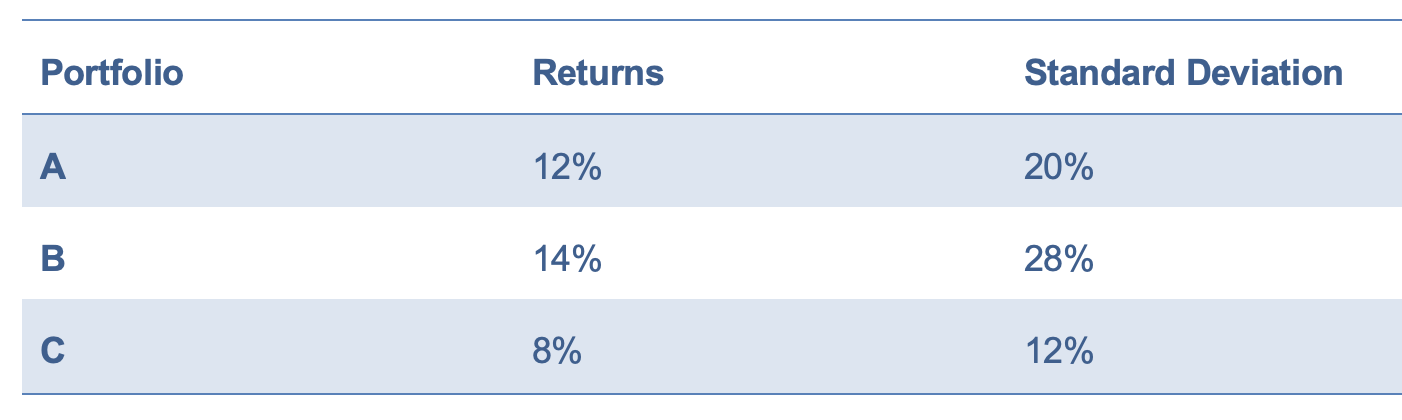
Assuming a risk-free rate of 5%, which of these portfolios has the highest Sharpe ratio?
- A financial analyst selects a sample of 100 mutual funds from over 8000 available mutual funds and calculates the average returns from these 100 mutual funds. It is 13.5%. Based on this sample, he then estimates the mean returns of all the mutual funds to be 13.5%. With respect to this, which of the following statements is most accurate?
- A personal finance magazine has published a ranking of top 10 stocks based on their P/E ratio. The data is most likely presented using:
- Which of the following is an example of data presented using ratio scale?
- We have the following returns from a stock over the past 10 years.

Calculate the arithmetic mean return for the stock.
- We have the following returns from a stock over the past 10 years.
What are the median returns for the stock?
- We have the following returns from a stock over the past 10 years.
What is the mode return for the stock?
- We have the following returns from a stock over the past 10 years.
What is the range for returns of the stock?
- We have the following returns from a stock over the past 10 years.
Assuming the data set is a sample, calculate the sample standard deviation.
- Assuming a skewed distribution, calculate the minimum percentage of the observations that will lie between ±5 standard deviations of the mean based on Chebyshev's Inequality?
- The kurtosis of a Leptokurtic distribution will be:
16 left